

Cost reports become available 24 to 48 hours after you start using the platform.
Historical spend
The Historical spend view shows an estimate of compute costs incurred by the platform over the past 30 days: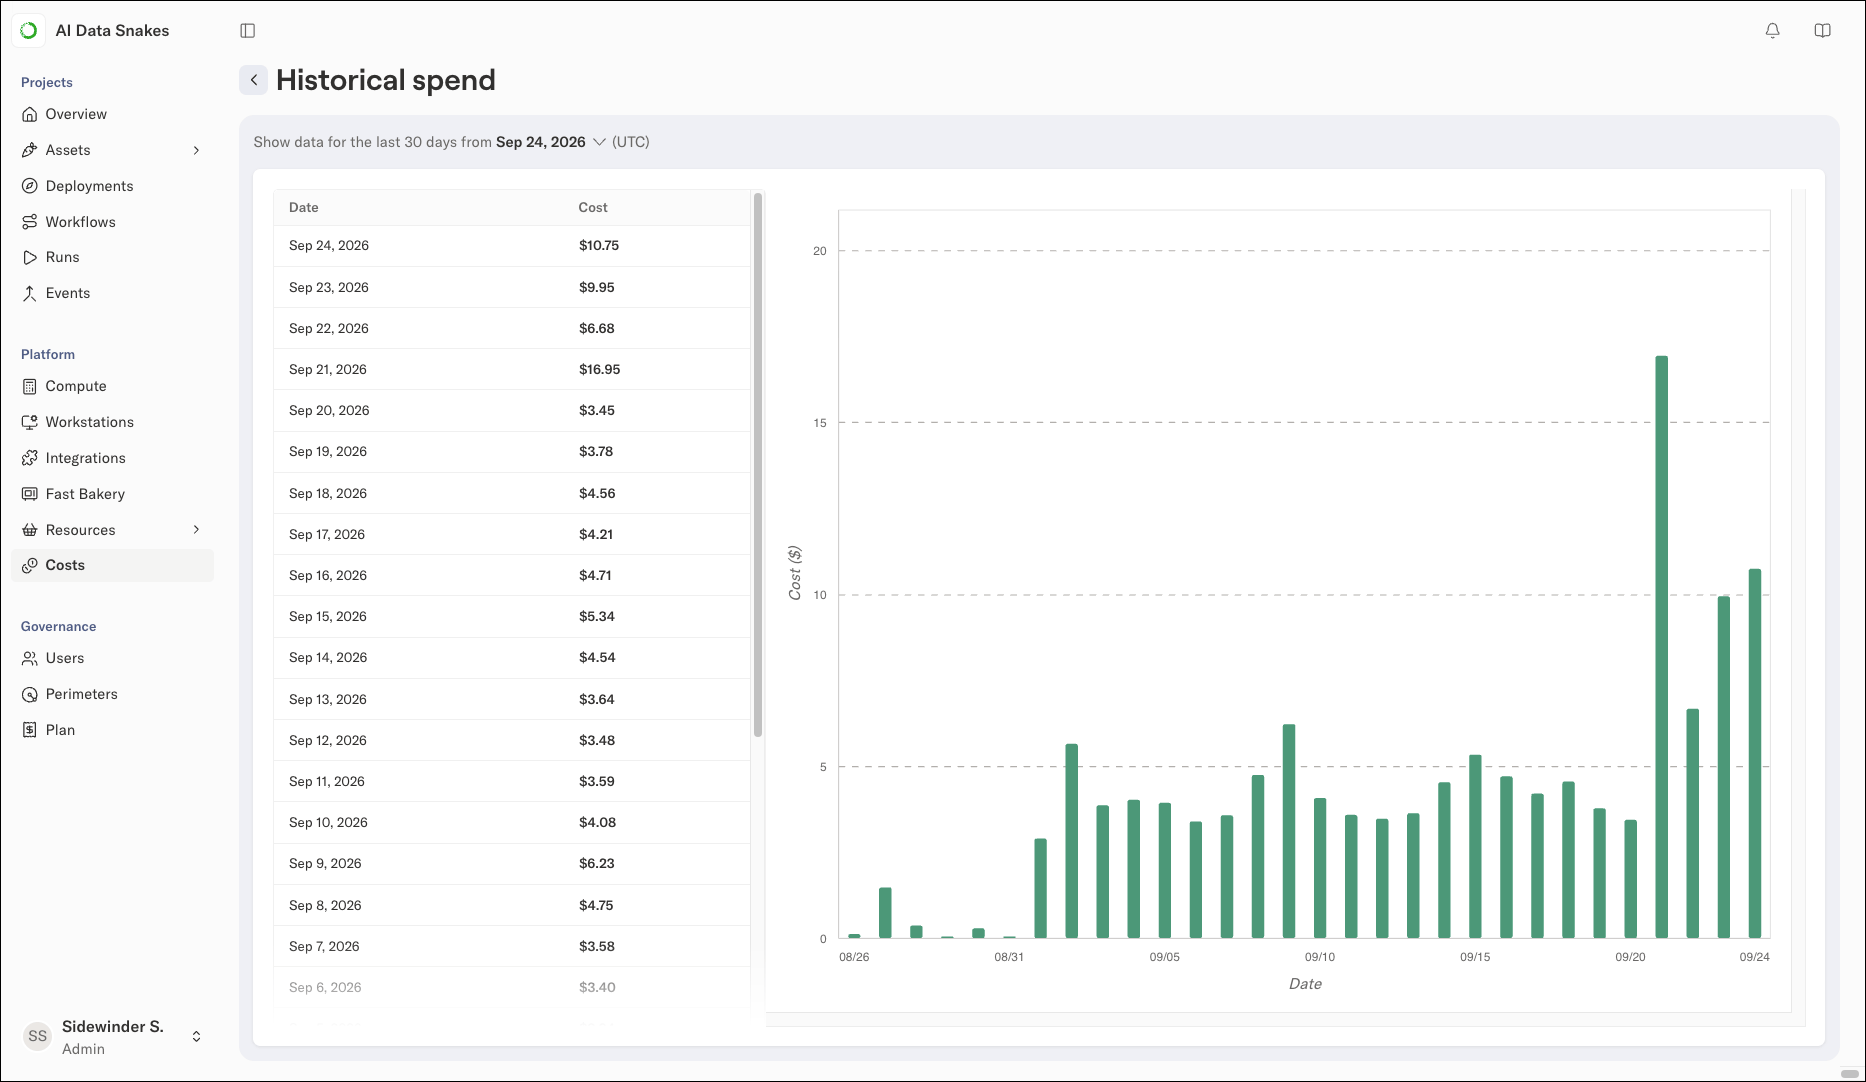
- The dollar amounts are based on the cloud’s on-demand list pricing, not your negotiated pricing. The amounts do not include discounts such as reserved instances or savings plans, so your actual compute costs are likely lower.
- The amounts indicate the variable cost component driven by compute on the platform. They do not include the platform’s total cost, which also includes data storage and database costs. Data costs are typically small compared to compute costs and grow slowly relative to the number of workloads.
- All amounts are quoted in US dollars, even if your account is set to use another currency.
Instance usage
To understand the daily costs shown in the historical view in detail, open the Nodes view and use the date picker to choose a day, such as a day with a cost spike in the historical view.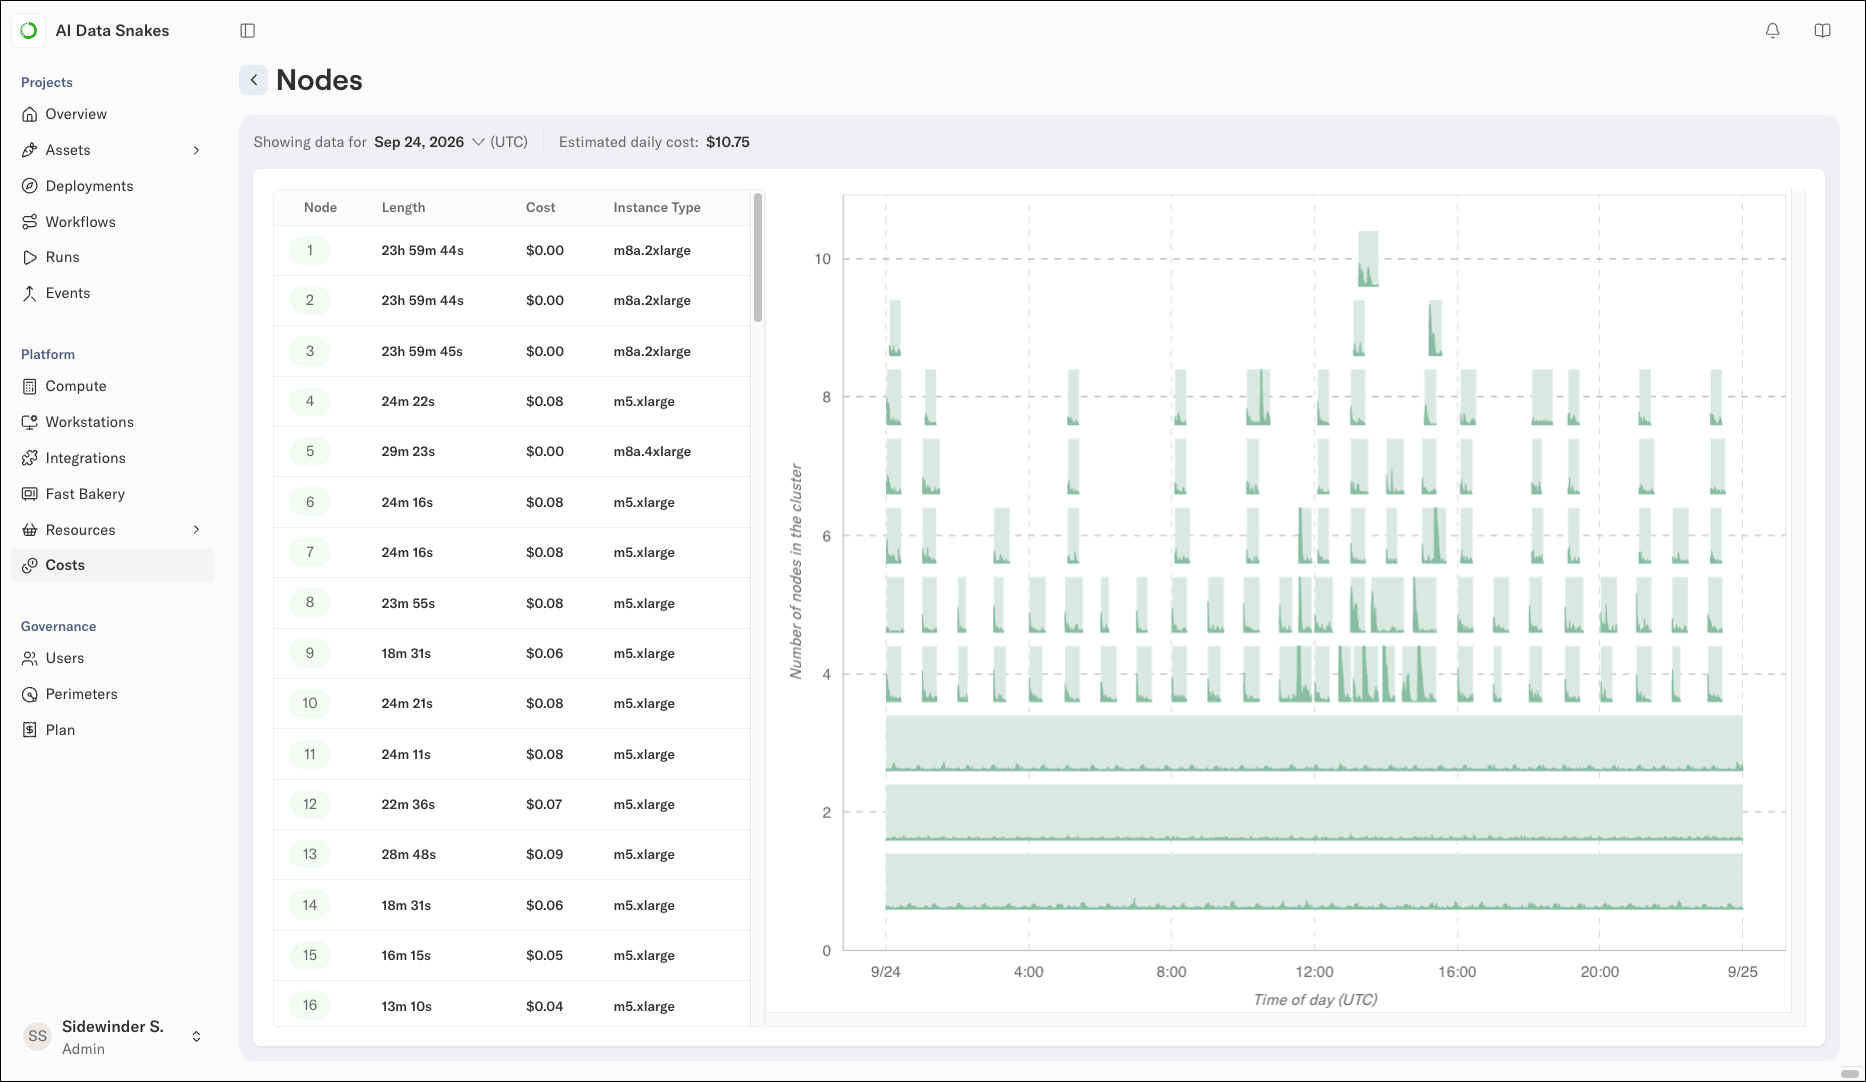
m8a.2xlarge instances ran for most of the day and account for most of the daily cost, while shorter-lived instances came and went as demand changed.
Why an instance was provisioned
A natural follow-up question is why the instance was provisioned. Click an instance’s span or its entry in the list to open a detailed view showing the steps and workstations assigned to the instance.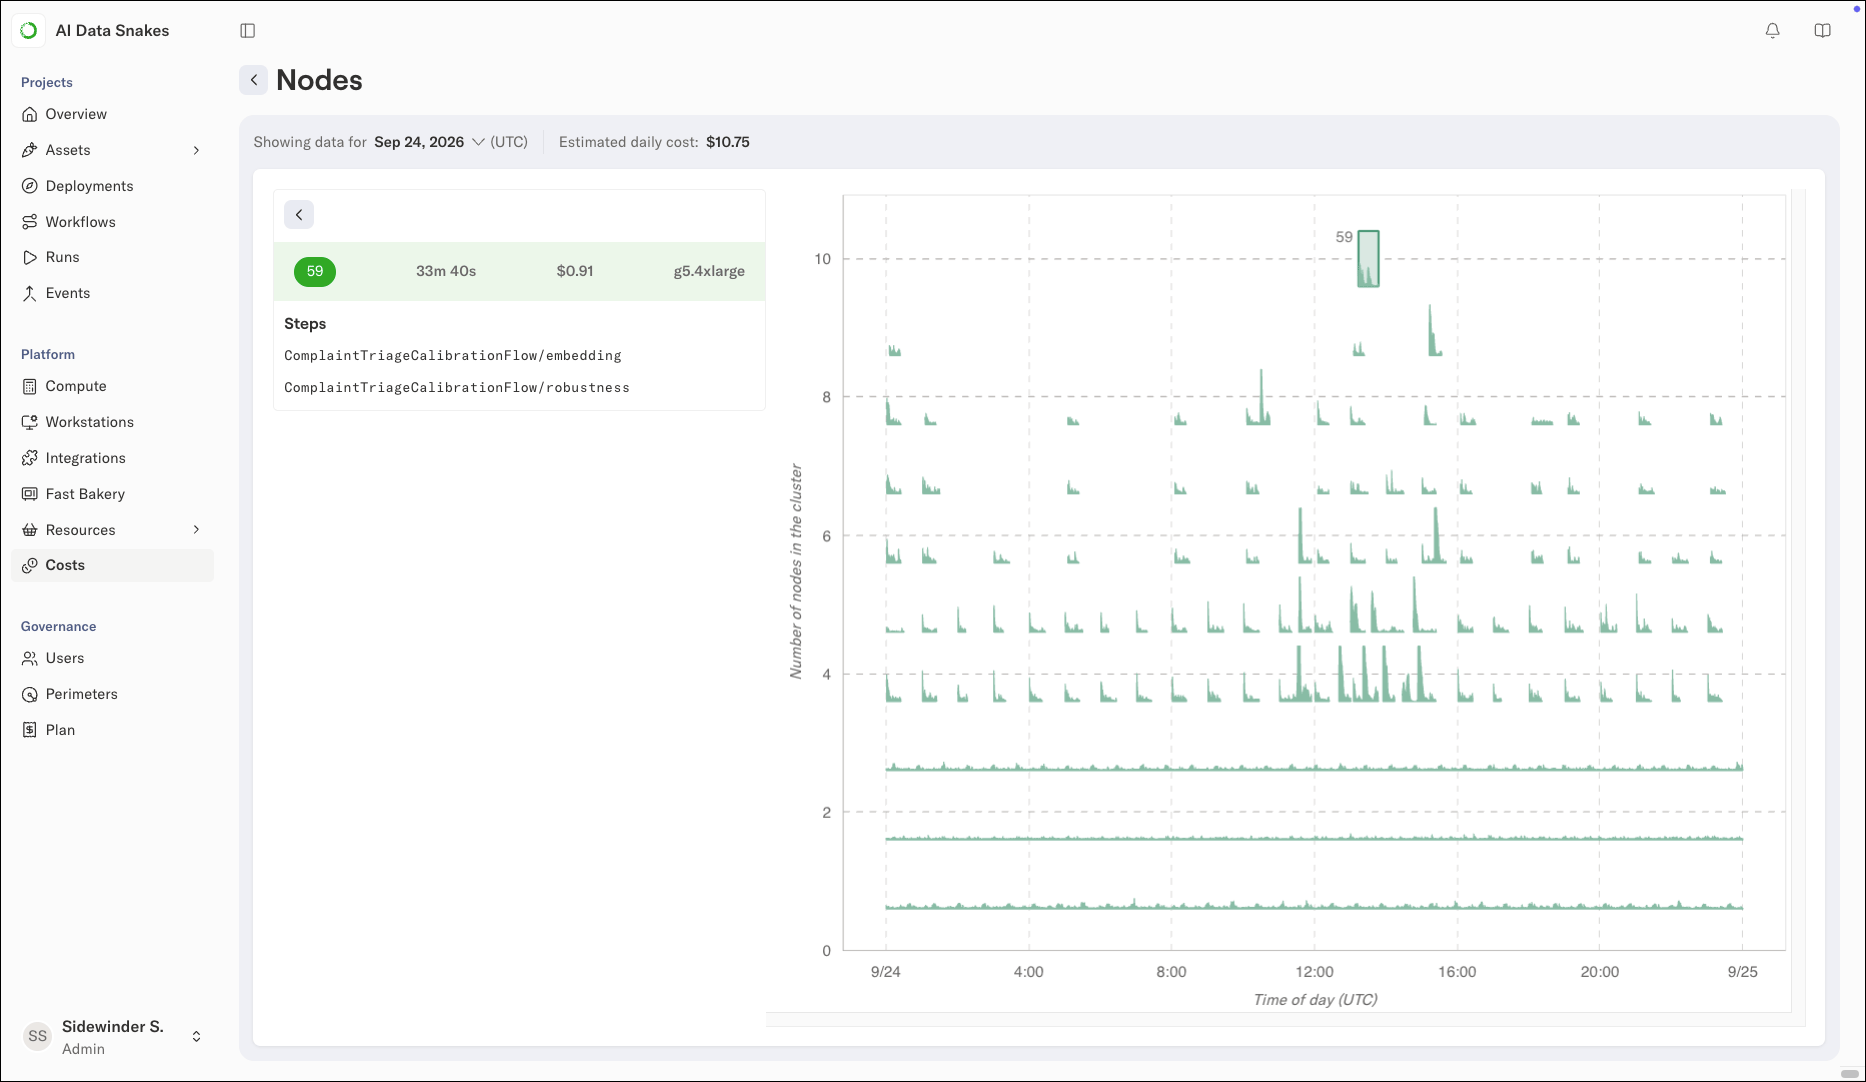
g5.4xlarge GPU instance that ran for about half an hour, provisioned for the embedding and robustness steps of ComplaintTriageCalibrationFlow.
Resource utilization
To check whether tasks are using their requested resources efficiently, open the Flows view. This view shows resource utilization for each step in your flows.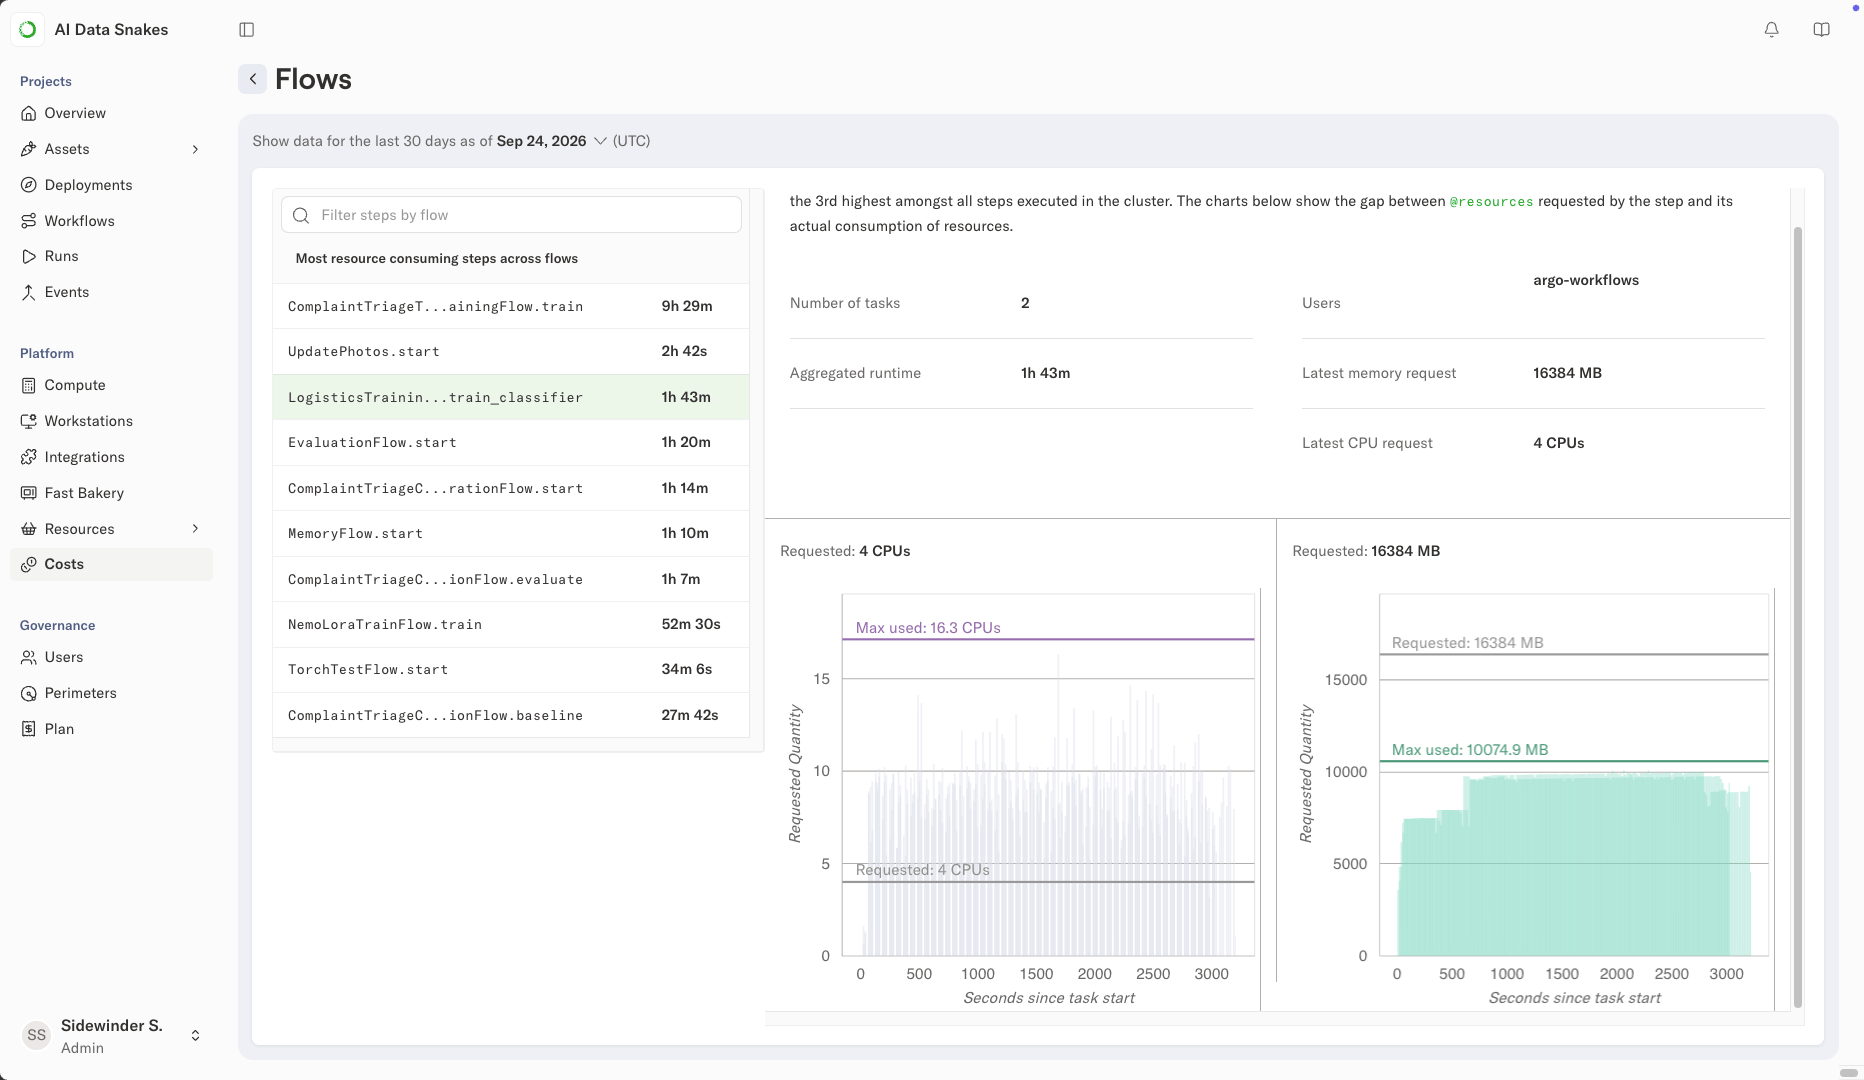
- One chart shows CPU utilization and the other shows memory utilization.
- The X axis shows seconds since the task started. A task often exhibits distinct behavior during its lifetime, such as higher memory consumption after data has been loaded.
- The charts aggregate resource consumption for the selected step over the past 30 days, so you see multiple time series overlaid. This shows the overall behavior while also revealing outliers.
-
A gray horizontal bar shows the amount of CPU or memory requested through the
@resourcesdecorator. A second bar shows the maximum resources used when it differs from the amount requested.
Observing resource utilization in real time
The cost reporting views aggregate information over longer periods and update daily. Anaconda recommends against optimizing resource requirements based on a single data point, especially for tasks that consume changing data. During development, however, it is useful to check whether resource requirements are in the right ballpark. You can see resource usage in real time while a run executes: select the run in the Runs view, select a task, and scroll to the Compute section, which shows CPU, memory, and network utilization charts: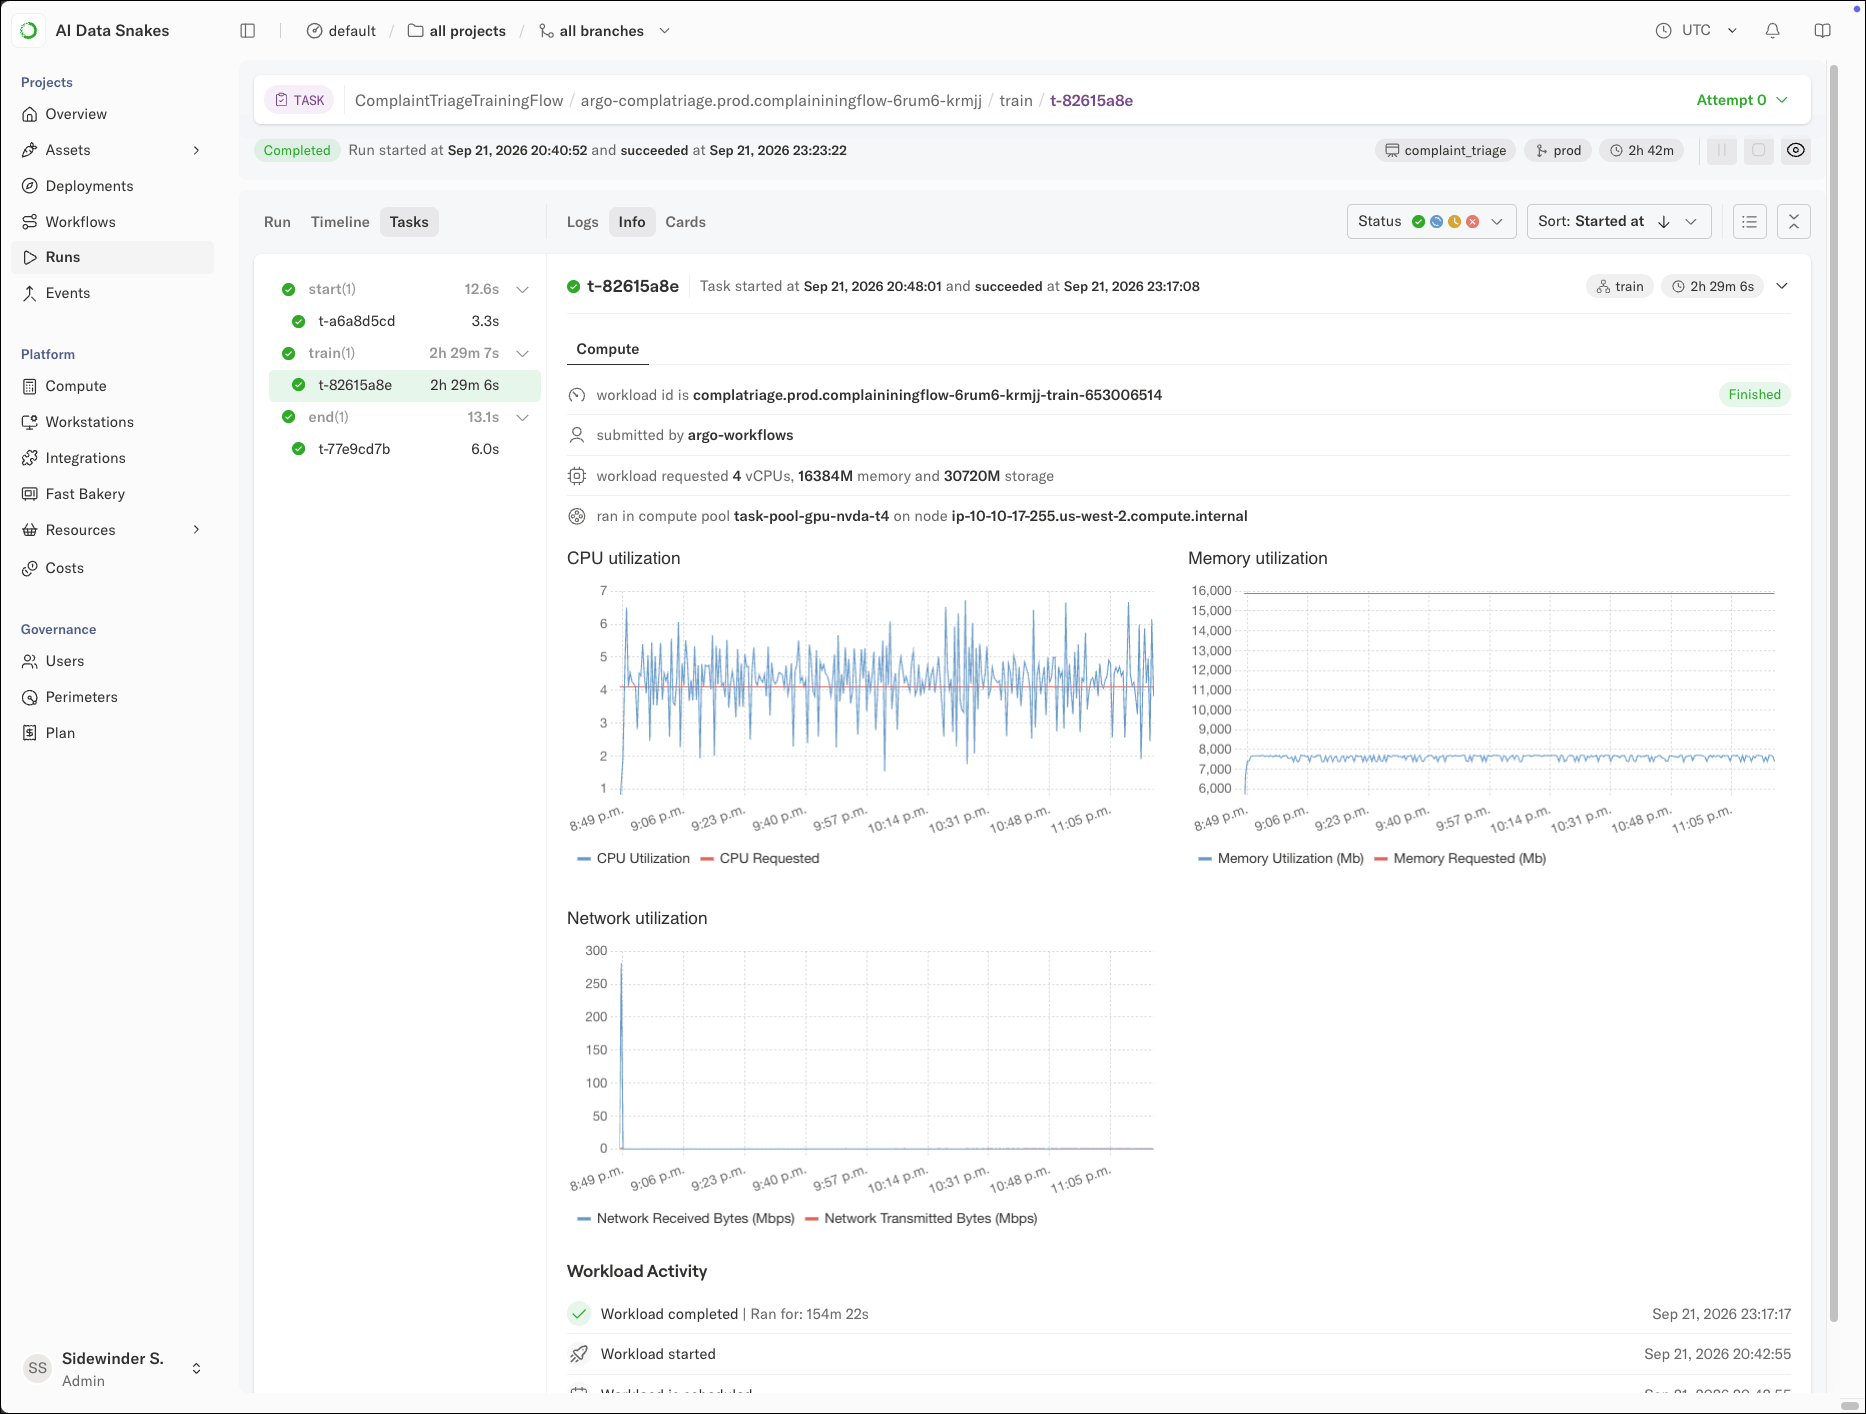
Utilization charts are only available for tasks that execute for longer than one minute.
Don’t set resources too low.A downside of setting
@resources too low, especially for memory, is that the task might crash with an Out-Of-Memory error, which is generally worse than slight underutilization.Identifying resource underutilization
This example highlights a case of resource underutilization: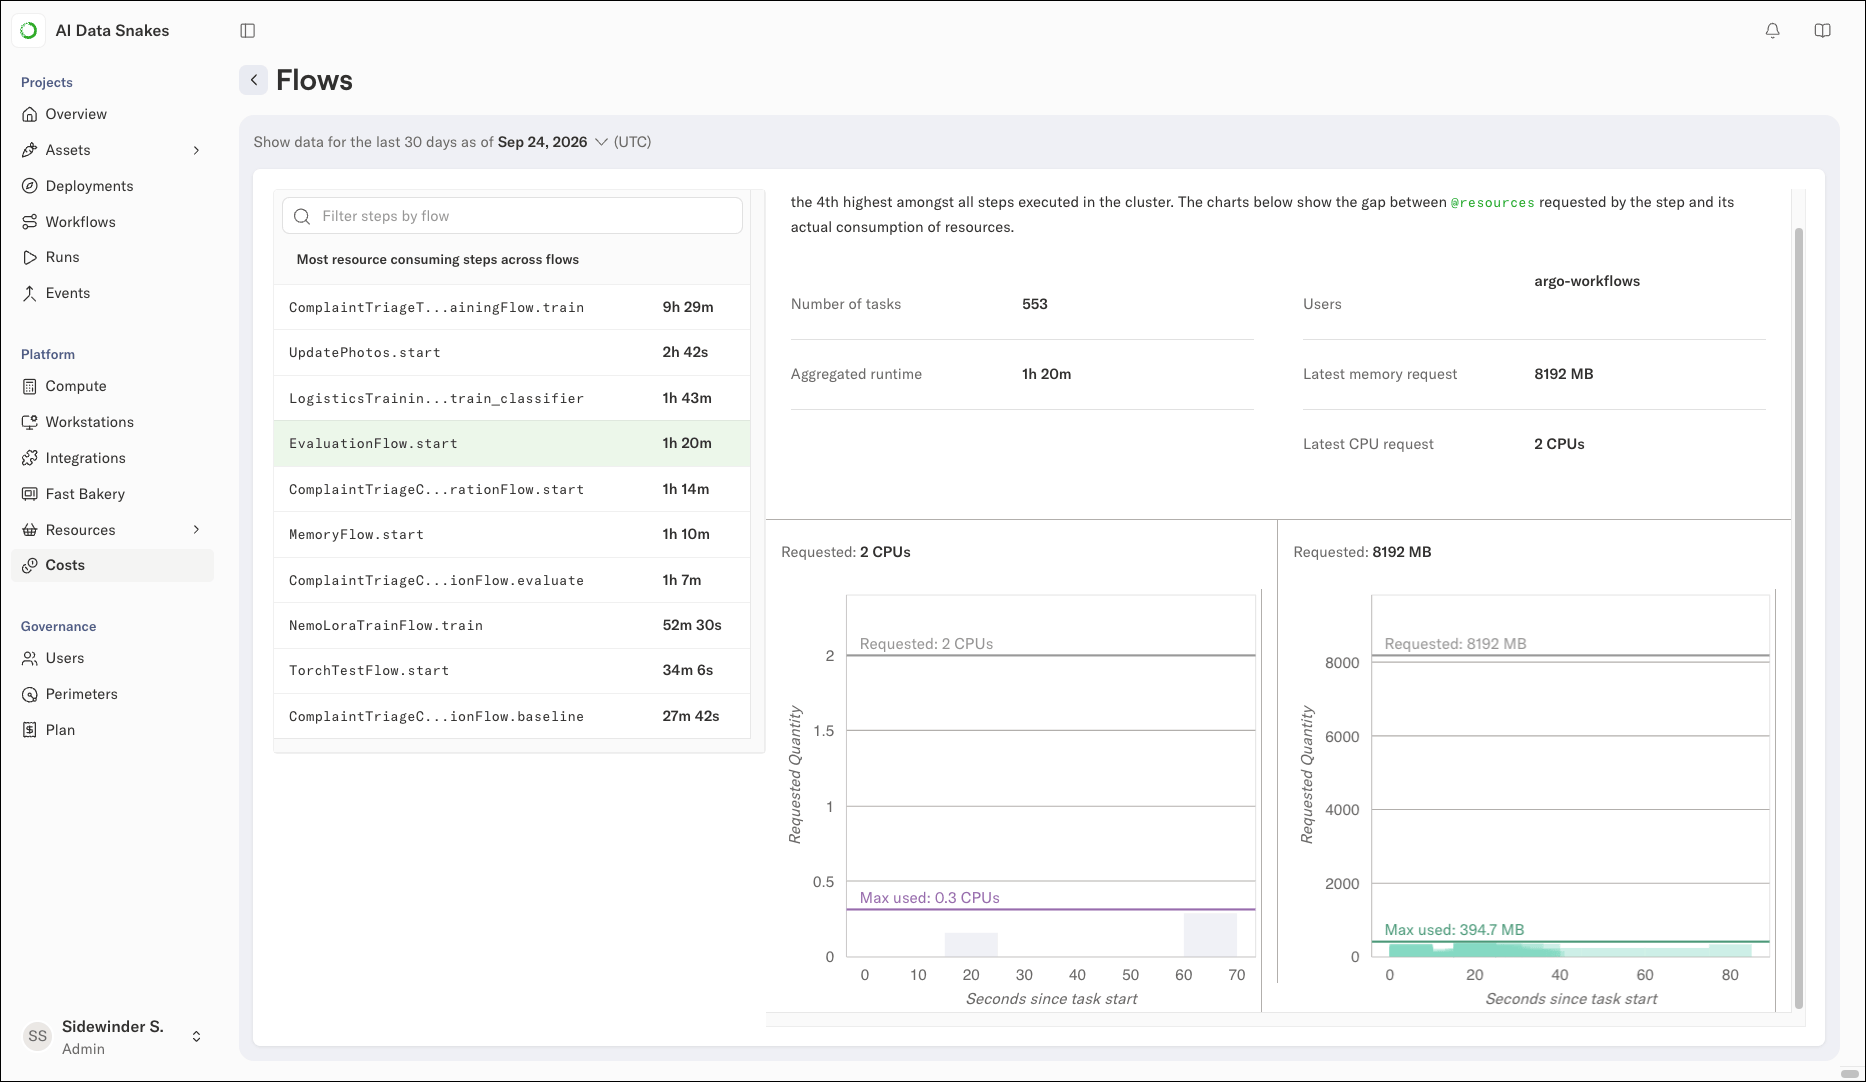
@resources(cpu=1, memory=2000) without an adverse effect. This frees resources on the instance, allowing other tasks to be scheduled simultaneously, which increases utilization and lowers total compute costs.
Why doesn’t the system optimize
@resources automatically?Resource consumption is typically a function of input data, which might grow or shrink over time. The platform surfaces the utilization data, but right-sizing decisions rely on your understanding of the data and use cases.