Open-Source Tools for Graph Data Science

2min


Do you have data that you’d like people to be able to explore on their own? Are you always passing around snippets of code to load specific data files? These are problems that people encounter all the time when working in groups and using the same datasources or when trying to distribute data to the public. Some users are comfortable interacting with data entirely programmatically, but often it is helpful to use a GUI (Graphical User Interface) instead. With that in mind we have reimplemented the Intake GUI so that in addition to working in a jupyter notebook, it can be served as a web application next to your data, or at any endpoint.
Intake is a lightweight set of tools for loading and sharing data. You might have seen earlier blog posts. Intake separates the concepts of the data engineer – the person curating, managing, and disseminating data – from the data user – the person analyzing and visualizing the data. The data engineer sets up catalog files describing data sources and the data user loads data without needing to know how it is stored.
To use the GUI locally, pip/conda install intake and panel. Then run:
python -c "import intake; intake.gui.show()"This command will open a browser tab containing a panel application (more on this in the “How it Works” section)
If you’d rather work in the notebook open a notebook and run:
import intake
intake.gui
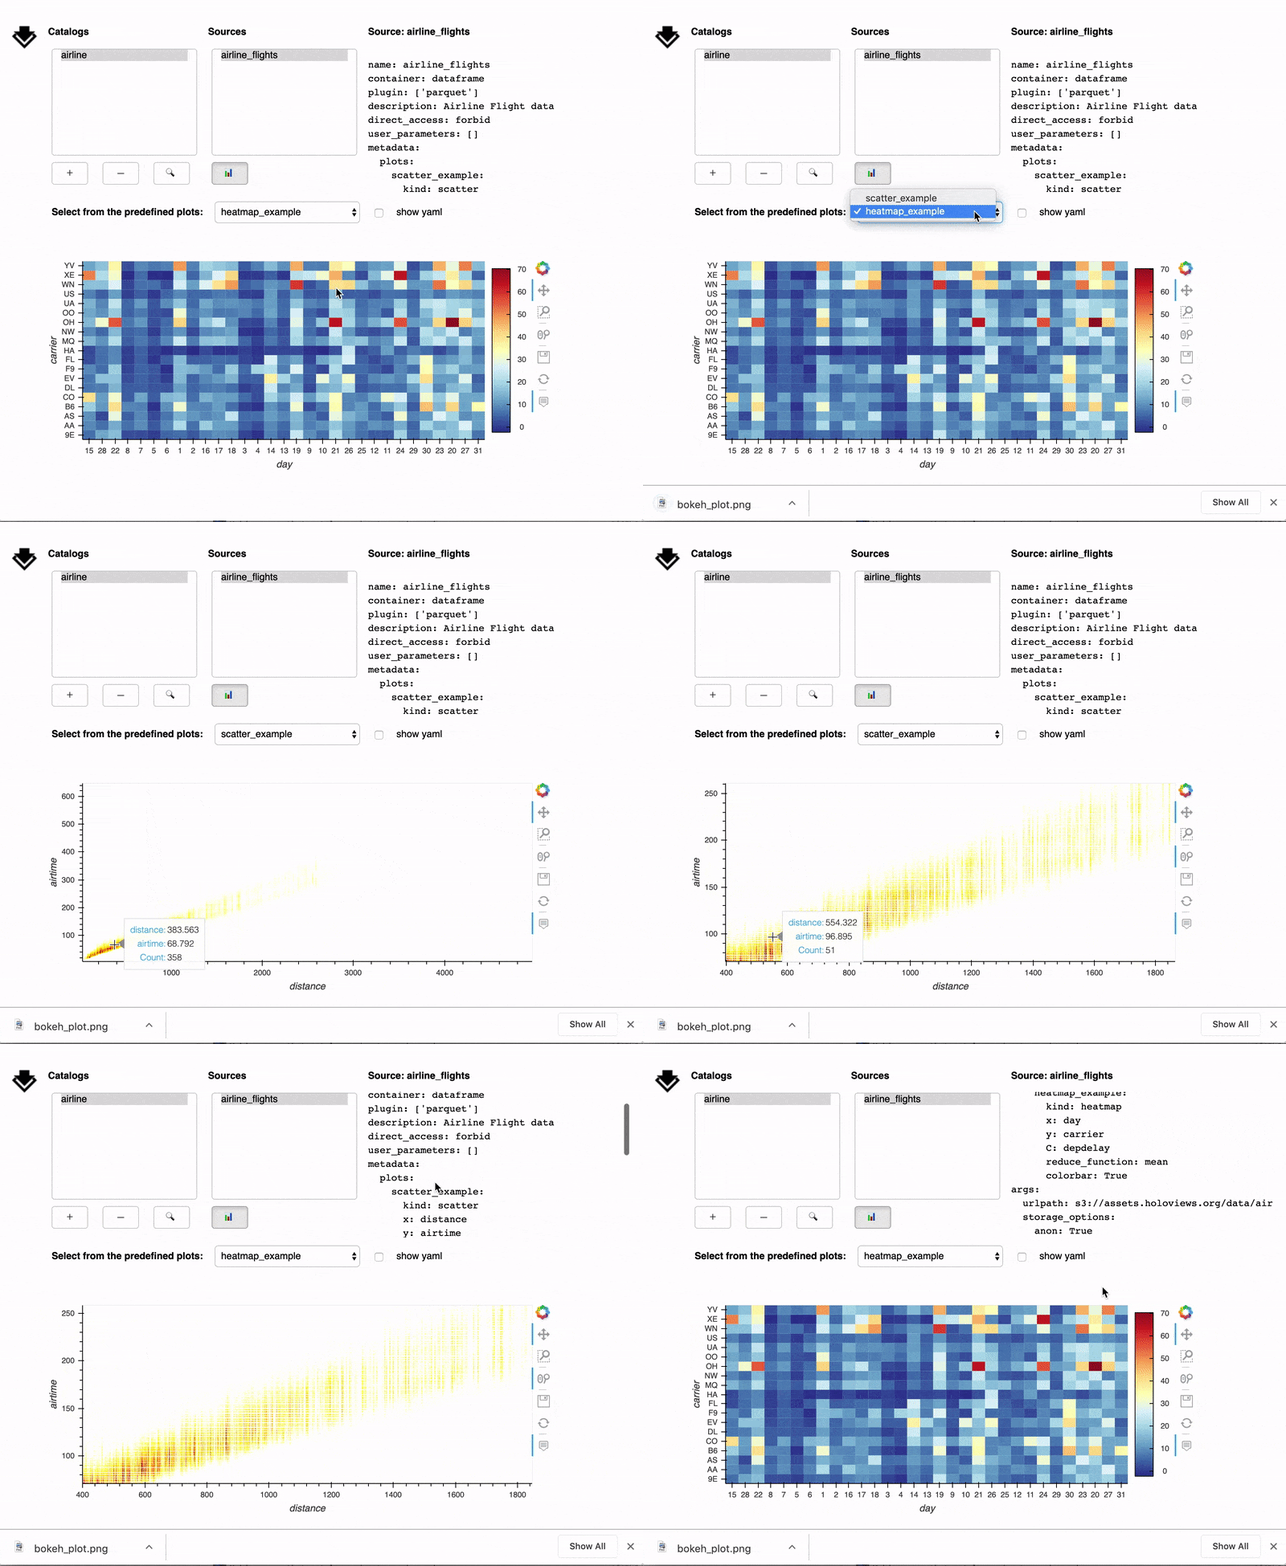
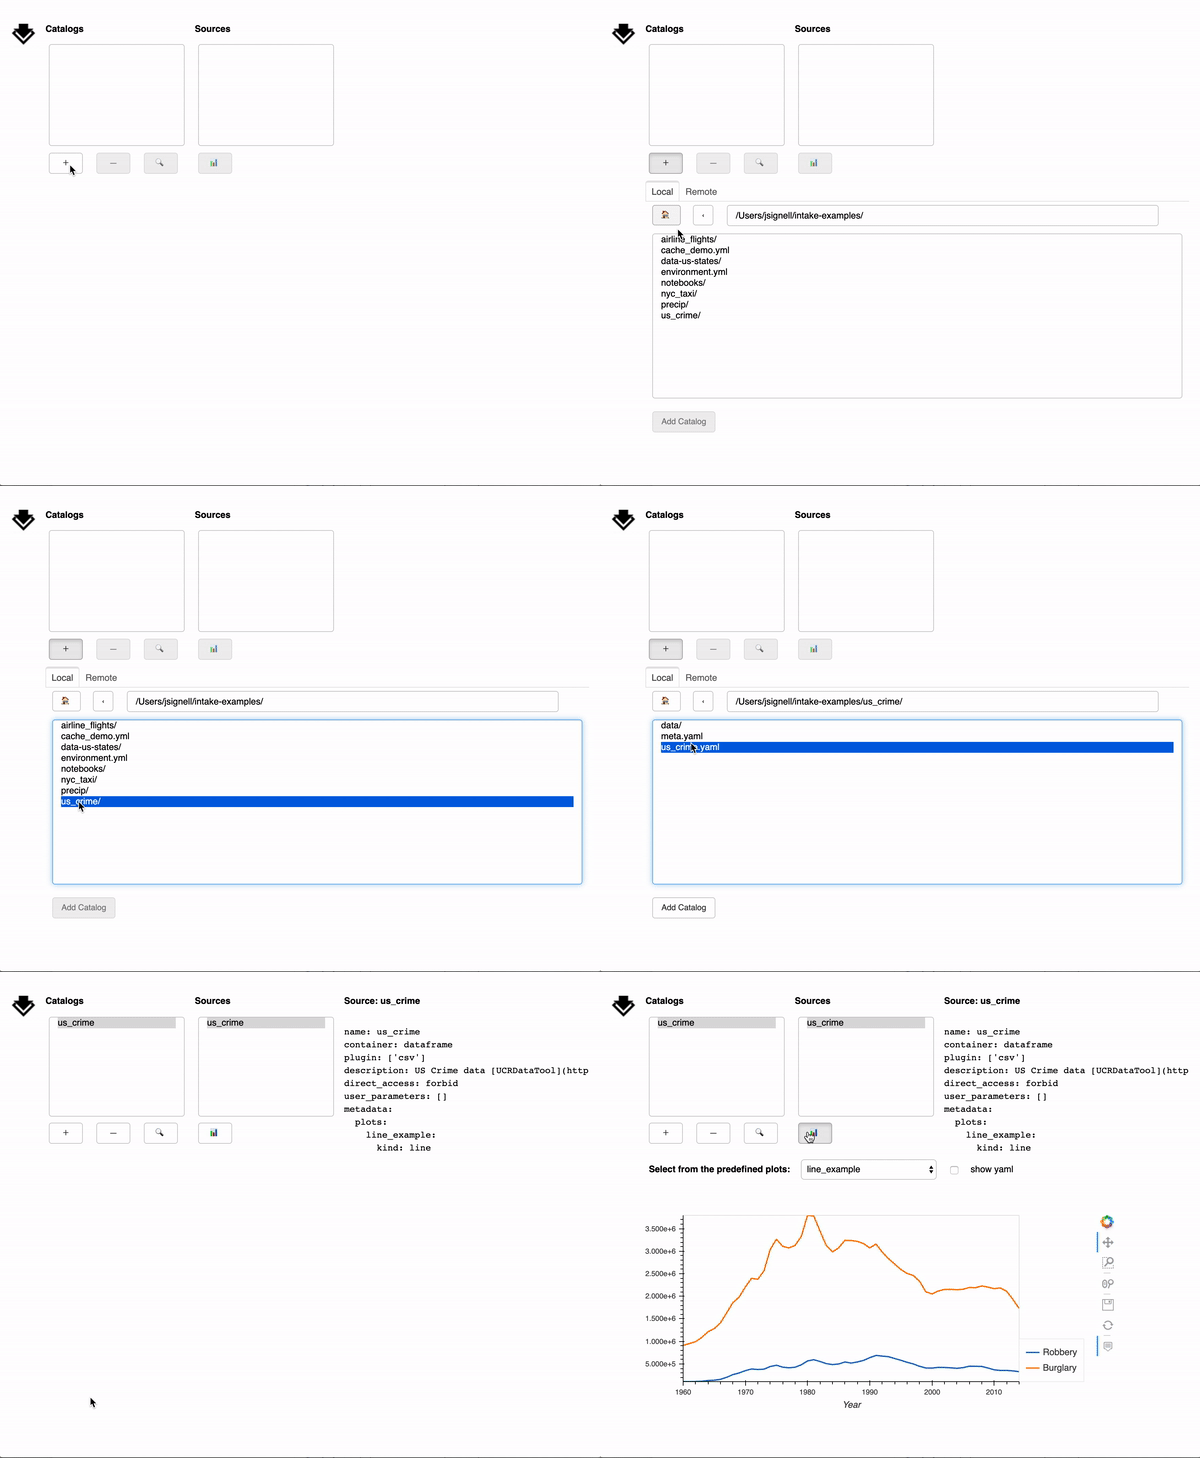
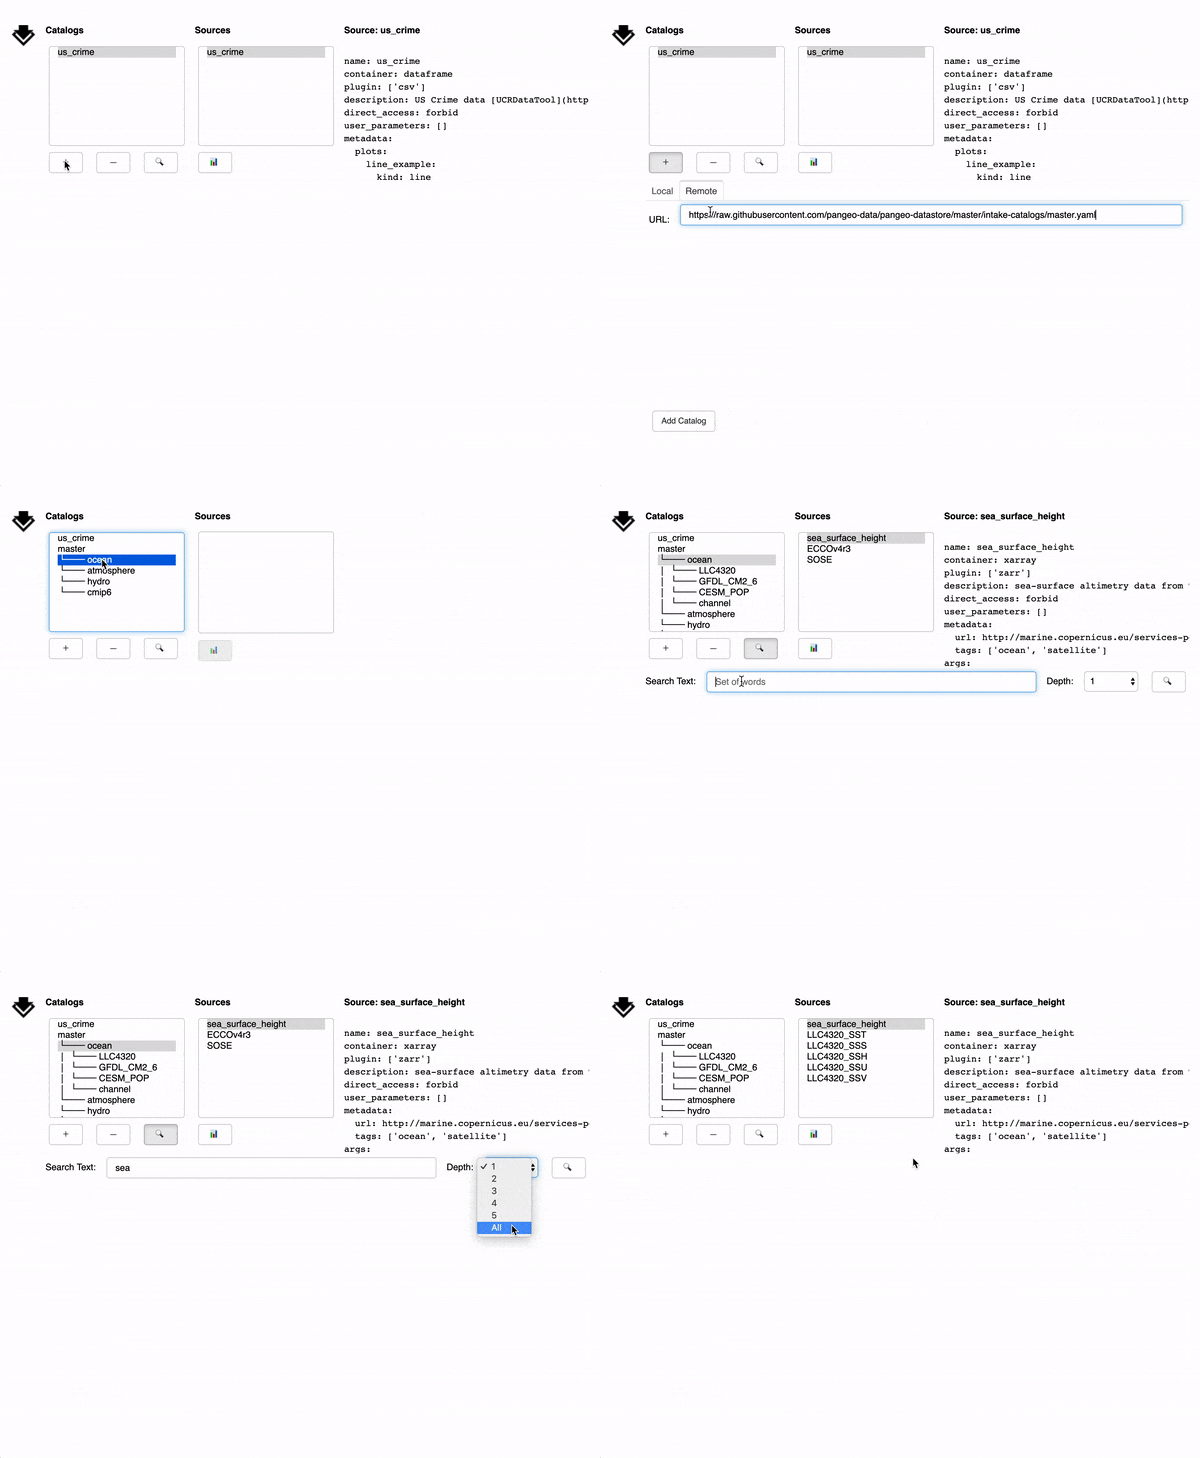
Once you have a GUI, you can add and remove catalogs from the GUI using the + and – buttons, select data sources from within catalogs, read the yaml that those describes those sources. Use the plot button to see the pre-defined plots that the data engineer has defined (if you would like to define some plots see the plotting docs)

For more information on how to interact with the new GUI, see the GUI docs.
The intake GUI is built using the latest project in the PyViz ecosystem: Panel. Panel provides a composable dashboarding solution for displaying plots, images, tables, or text and widgets for interacting with them. Panel works both in a Jupyter notebook and in a standalone secure web server using the same source code.
From the data engineer perspective this means that you can serve the intake GUI at an endpoint and use it as a data exploration tool for your data users. It also means that it is straightforward to customize and reorganize the GUI to insert your own logo, reuse parts of it in your own applications, or add new functionality.
We have ambitious plans for the future of this GUI. In the near future, we anticipate adding a mechanism for inputting user parameters, adding some basic custom plotting, and allowing the editing and saving of catalogs. See GH#225 for a full discussion of the vision.
Talk to one of our experts to find solutions for your AI journey.