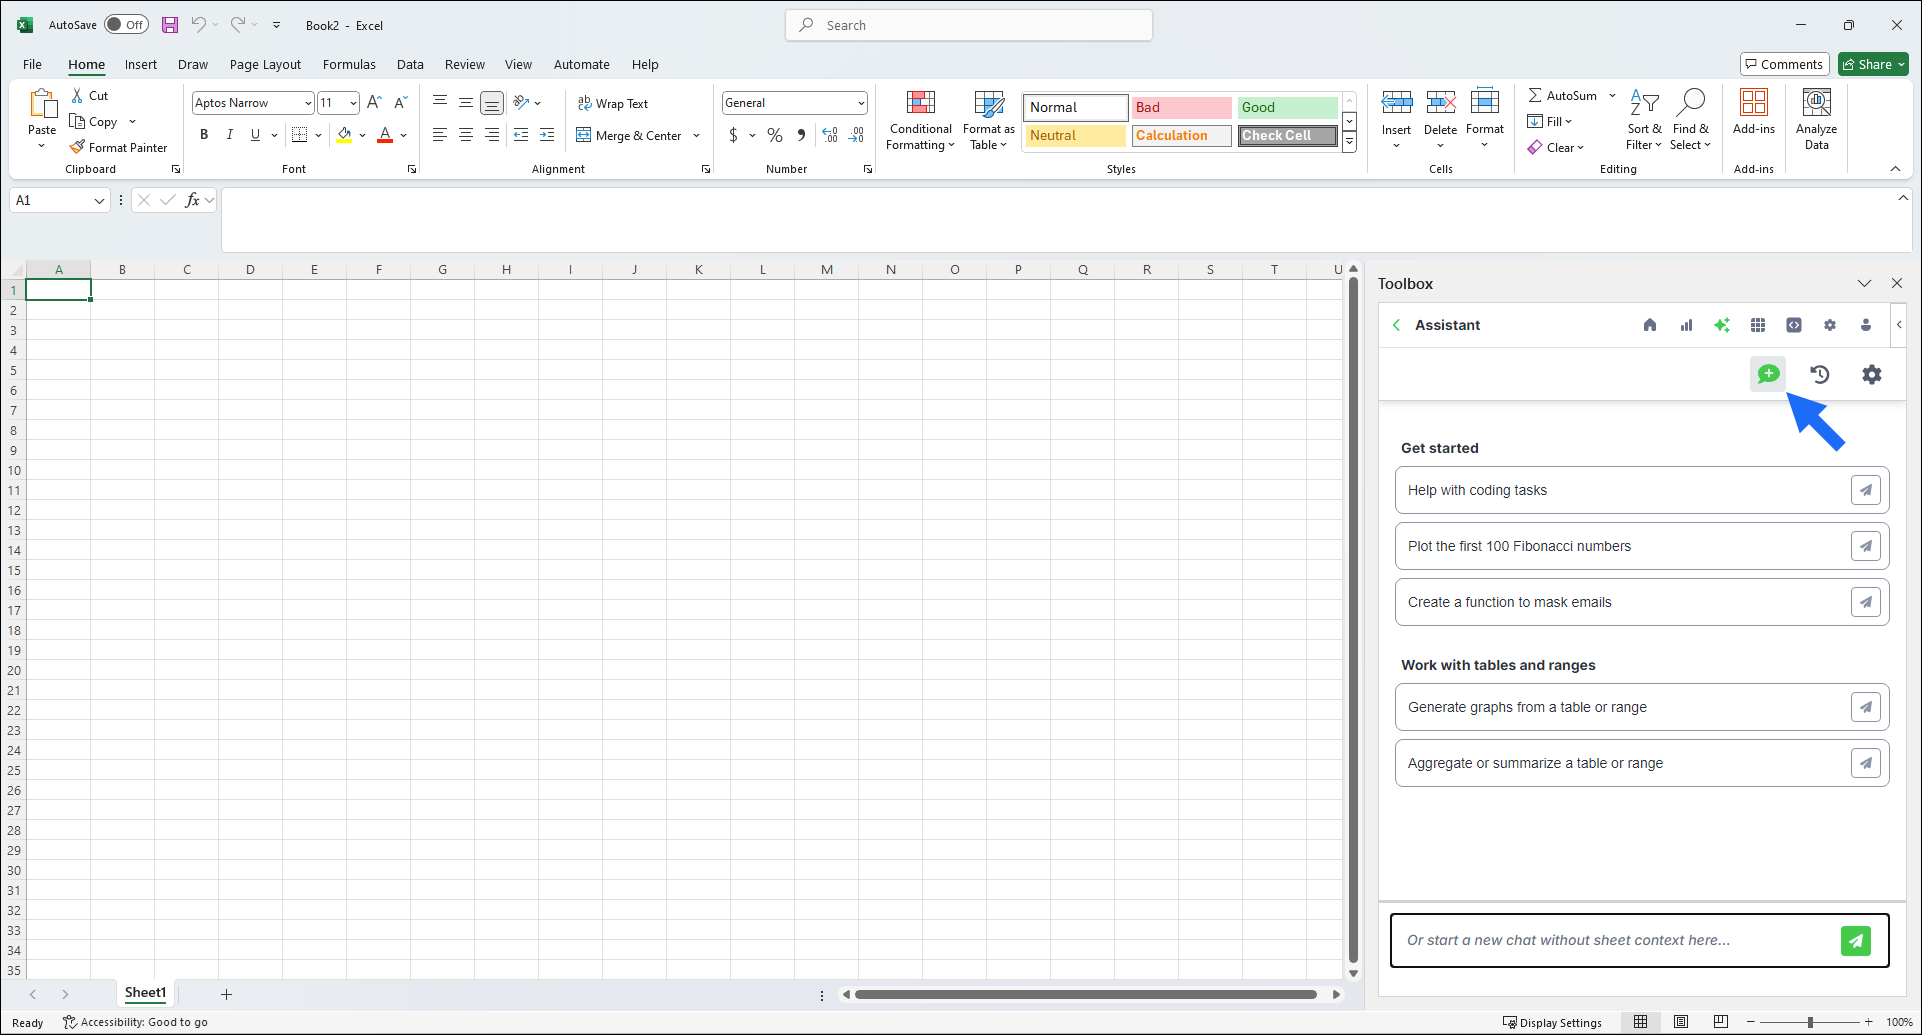
Ask the Assistant
Use the Assistant to create Python code for analyzing your data.- Under Help with coding tasks, click Generate python code to….
- Pose prompts to the Assistant for guidance on analyzing the data in your workbook.
- When provided code to run, set the placement in your workbook and click Run.
Generate a chart
Use the Assistant to create Python code for rendering charts.- Under Work with Tables and Ranges, click Generate a chart from a table or range.
- Click the input cell that appears, then, in the dropdown, select a specific sheet or manually select a range of cells.
-
The Assistant provides a list of possible charts it can generate Python code for. Use the text box to choose which chart you would like generated or to ask for a new set of possibilities. Type something like the following:
- 1
- Generate the second idea
- chart #3, please
- Give me new options!
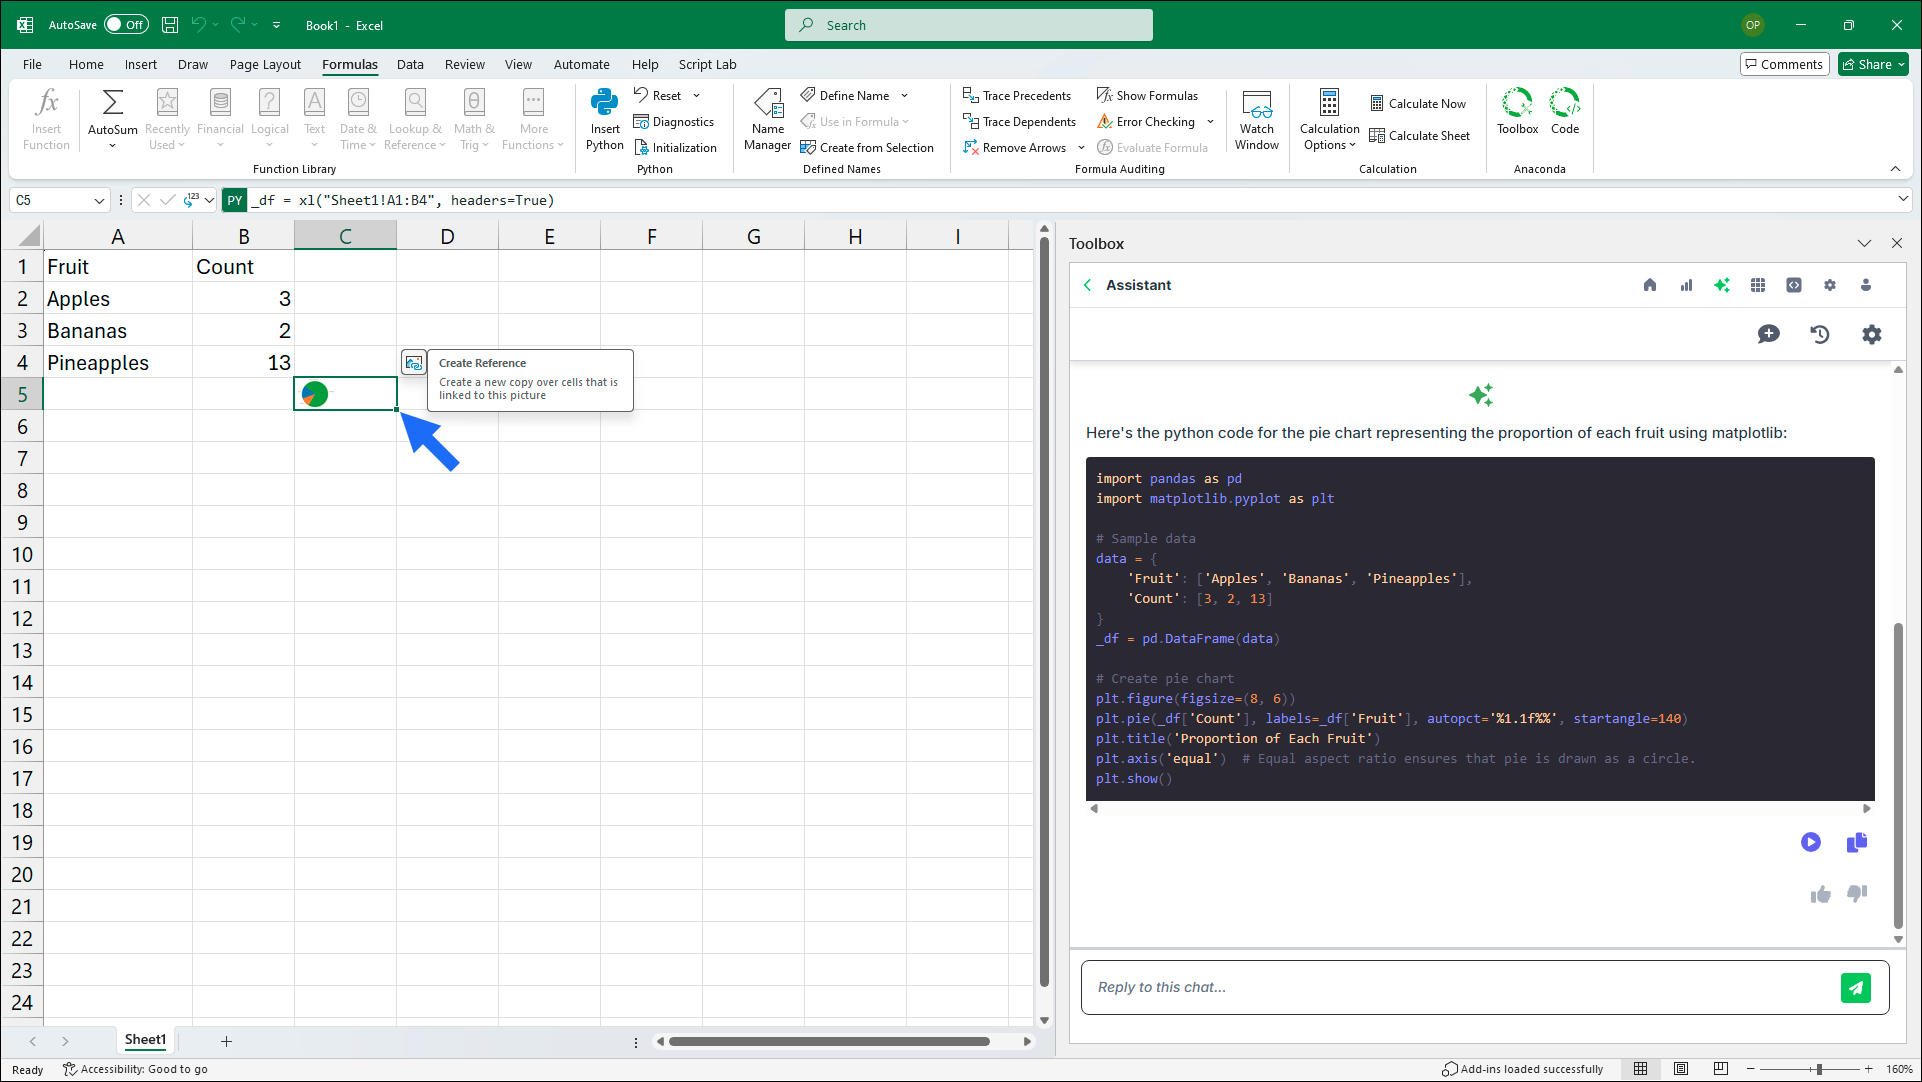
- Once the Assistant has provided the code, click the Placement in Workbook cell and select a cell in your workbook to render the code.
-
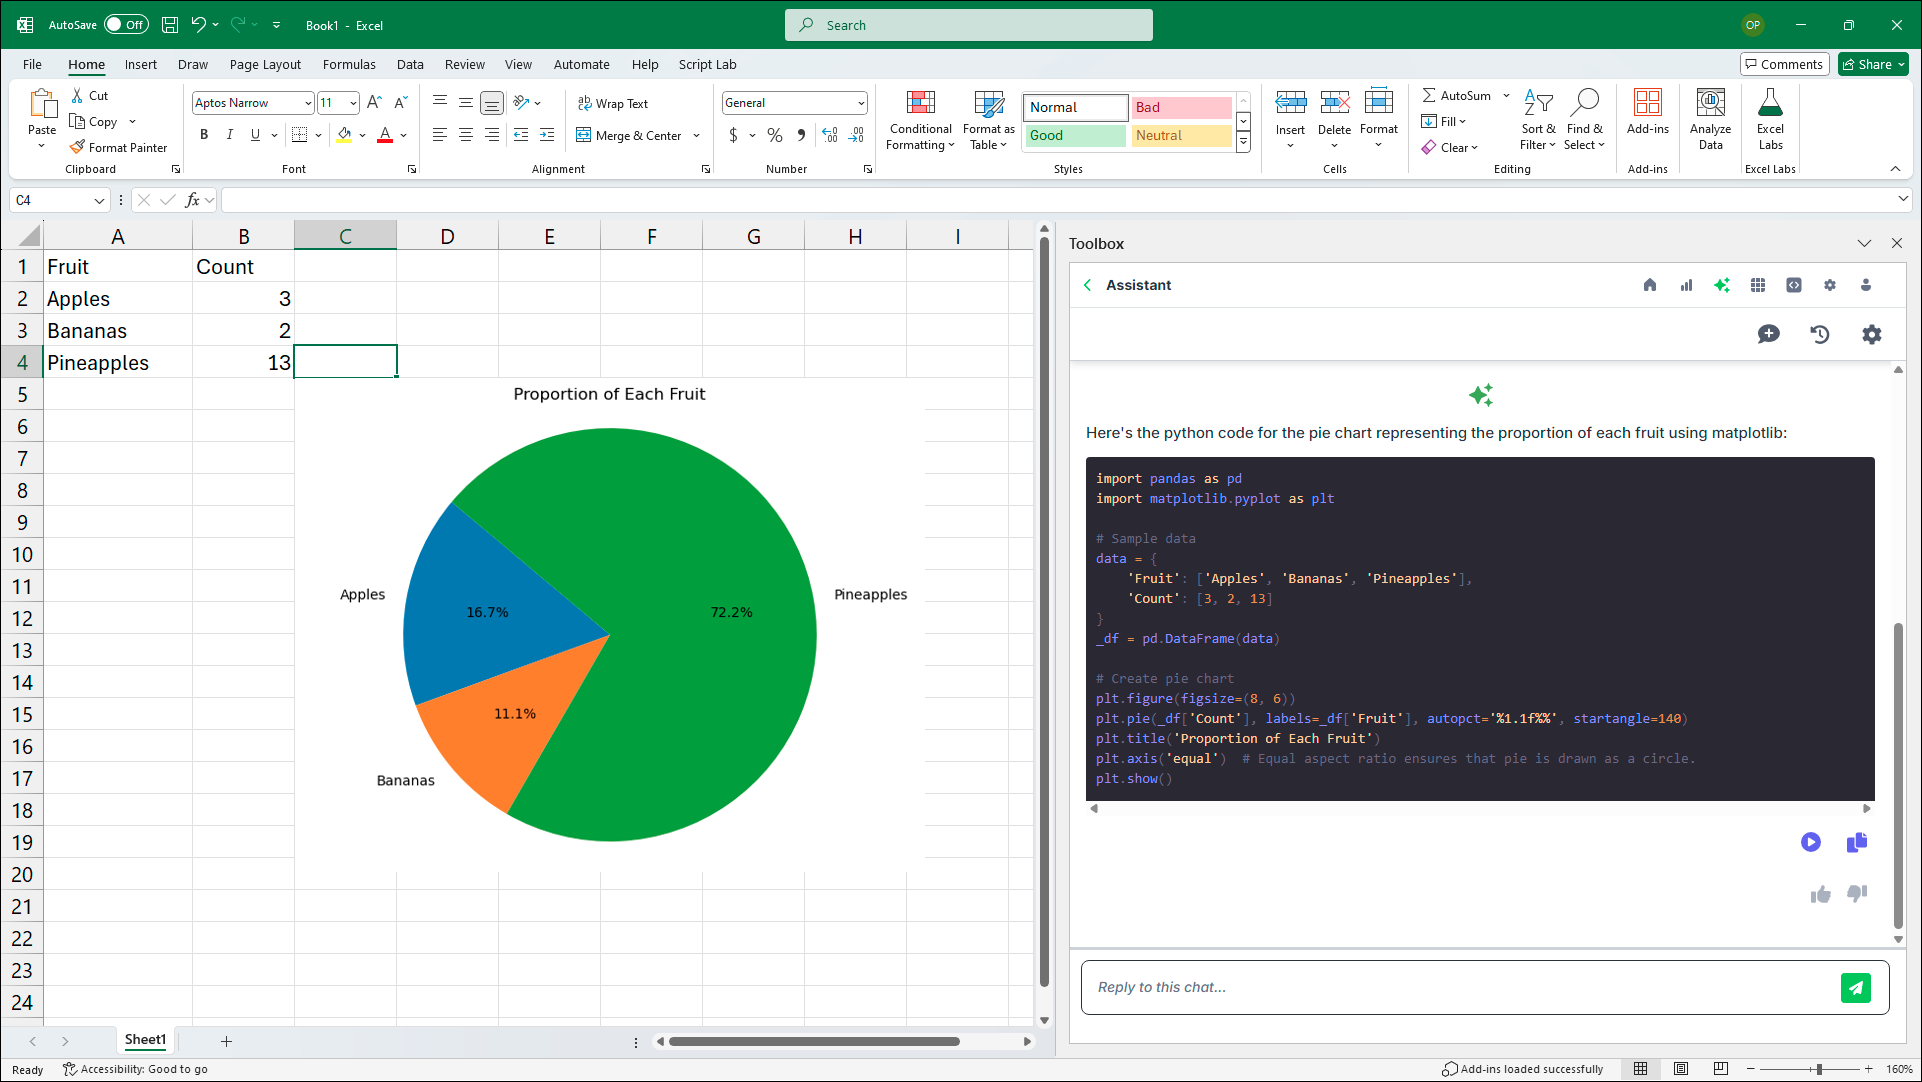
Click Run.
-
The chart renders in the cell you set under Output. To view an enlarged copy of the chart, select the cell, then click Create Reference.
Aggregate or summarize a table or range
Use the Assistant to create Python code to aggregate your data.- Under Work with Tables and Ranges, click Aggregate or summarize a table or range.
- Click the input cell that appears, then, in the dropdown, select a specific sheet or manually select a range of cells.
-
The Assistant provides a list of possible calculations it can generate Python code for. Use the text box to choose which chart you would like generated or to ask for a new set of possibilities. Type something like the following:
- 1
- Generate the second idea
- calculation #3, please
- Give me new options!
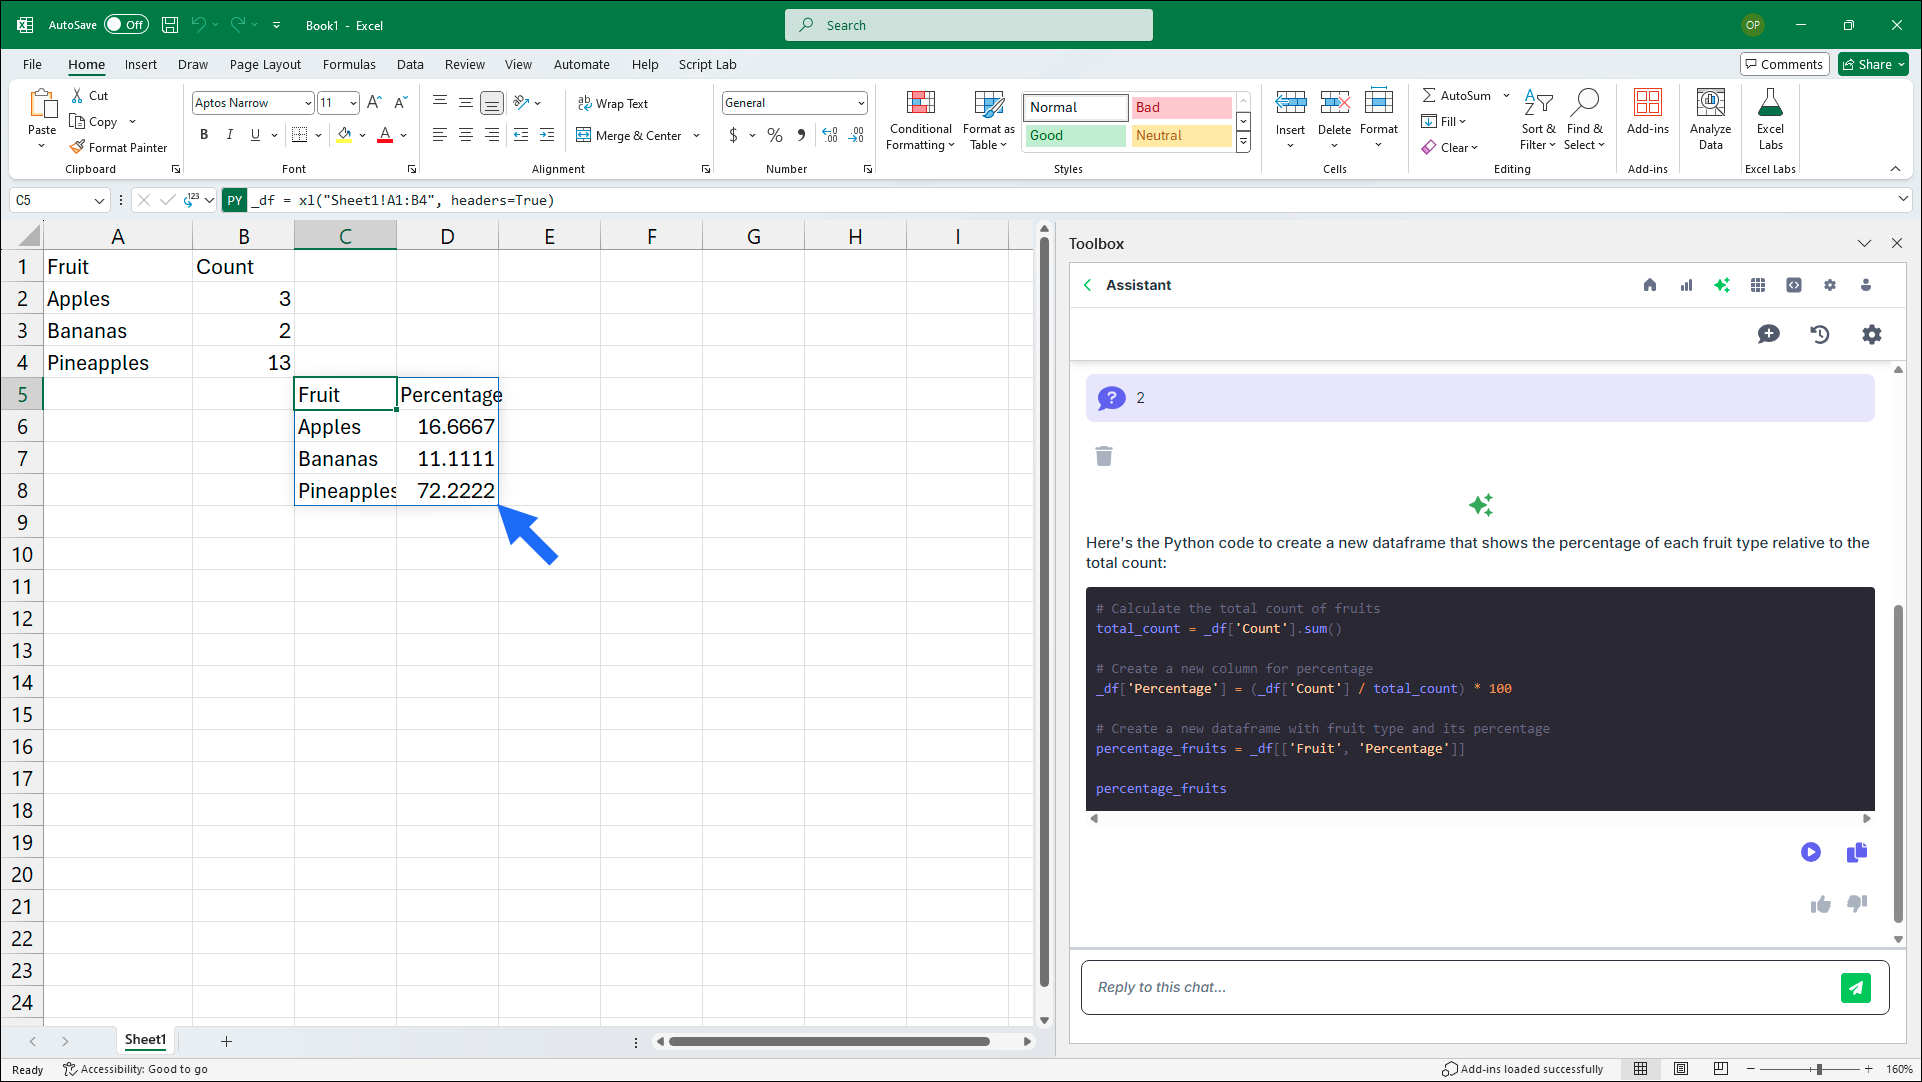
- Once the Assistant has provided the code, click the Placement in Workbook cell and select a cell in your workbook to render the code.
-
Click Run.
-
The results render in the cell you set under Output.
If the results shows up in the Diagnostics pane, manually remove the
print(and closing)from the formula bar above the sheet.
Start a new chat
To start a new chat, click New Chat.