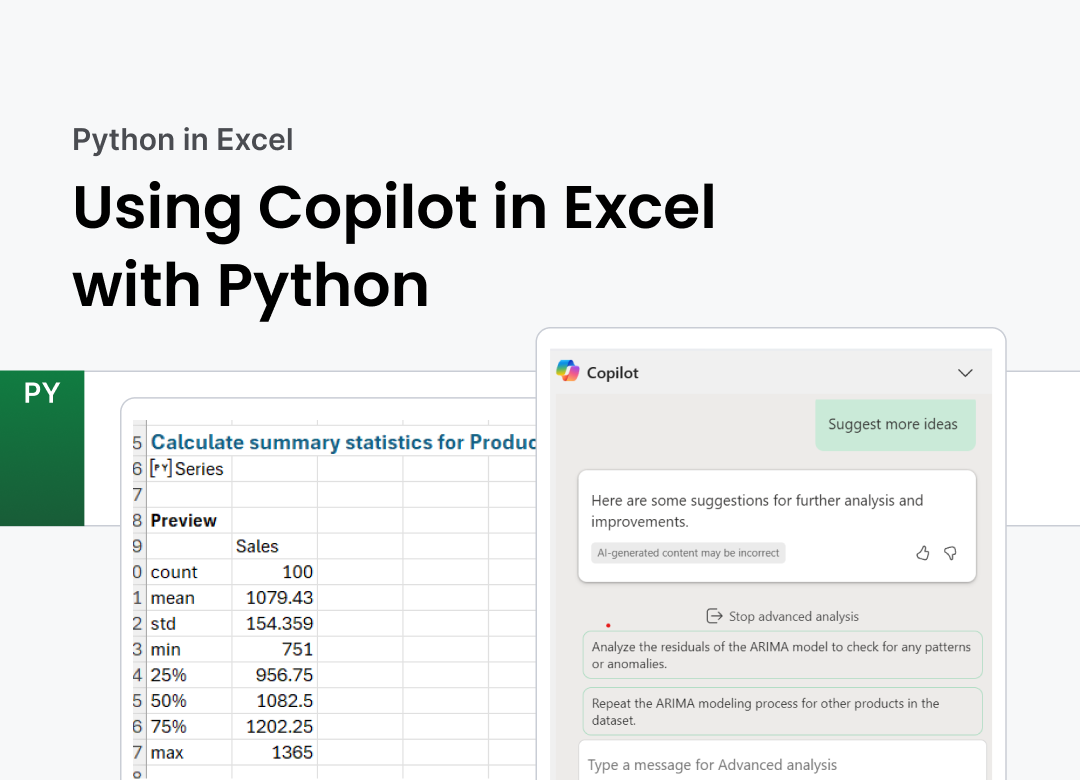
Python in Excel
Oct 9, 2024
A Comprehensive List of Python in Excel Resources

For business professionals and analysts, Excel has long been the go-to tool for handling data. Yet, its limitations often require users to juggle external platforms for more advanced tasks like automating workflows, building custom functions, or conducting deep data analyses. Enter Copilot in Excel with Python: a game-changing combination that transforms how you work with data by bringing the power of Python and AI-driven assistance directly into your spreadsheets.
In this post, we’ll dive into the synergy between Excel and Copilot, showing how this duo can supercharge your workflow. From automating repetitive tasks with Python scripts to using Copilot’s AI capabilities to generate complex formulas or debug your code, you’ll see how these tools work together to bridge gaps and elevate your productivity. Whether you’re optimizing financial models, analyzing datasets, or building interactive dashboards, Copilot in Excel with Python unlock new possibilities for data handling and decision-making.
Getting started is simple: Copilot suggests code and formulas as you type, while Python’s seamless integration with Excel lets you run powerful libraries like Pandas, NumPy, and Matplotlib within your workbook. Together, they empower users of any skill level to streamline tasks, uncover insights, and make data-driven decisions—faster and more effectively than ever before.
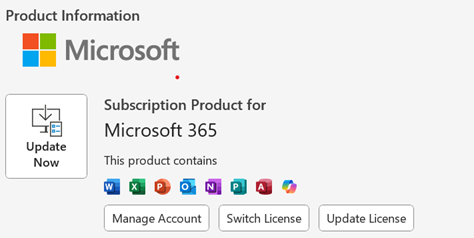
Getting started with Copilot in Excel is like adding a powerful co-pilot to your workflow, always ready to assist and elevate your spreadsheet game. Whether you’re optimizing models, automating tasks, or performing advanced analyses, setting up Copilot in Excel with Python is straightforward. To begin, open the latest version of Excel and ensure you’re signed in with a Microsoft 365 account that includes access to Copilot. This feature requires a specific license, so verifying your subscription is crucial. Navigate to File > Account > Update License to check and update your license if necessary, and restart Excel to apply any changes. Under the Product Information section in the Account menu, confirm that your license supports Copilot by looking for the Copilot icon in the toolbar.
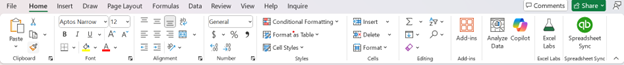
Once everything is set up, you’ll find Copilot on the Home ribbon, ready to assist with tasks such as generating formulas, writing code snippets, or troubleshooting complex workflows.
If Copilot is enabled, it’s likely that Python in Excel is also available. To confirm, simply type =py into any cell. If Python is active, you’ll see an embedded Python editor open, allowing you to execute Python code directly within Excel.
Here we are exploring a dataset featuring monthly sales data for multiple products over time from 2020 to 2028. Each product exhibits a general upward trend in sales over time, simulating real-world growth influenced by marketing efforts, seasonal campaigns, and expanding customer bases. Such data is crucial in business for understanding performance, planning inventory, setting revenue targets, and identifying potential growth opportunities. By analyzing trends and seasonality, businesses can make data-driven decisions to optimize operations and improve profitability.
Using Copilot in Excel with Python, we can seamlessly integrate advanced time series analysis into Excel workflows. This dataset can be forecasted using an ARIMA (AutoRegressive Integrated Moving Average) model, a powerful tool for capturing both trend and seasonality components. ARIMA allows businesses to predict next month’s sales, enabling proactive planning for inventory, staffing, and promotions. In this post, we’ll demonstrate how Python in Excel, paired with Copilot, simplifies the process of forecasting and brings advanced analytics into a familiar spreadsheet environment. No additional plugins or coding needed.
We can use Copilot to better understand our data set by proving it the prompt:
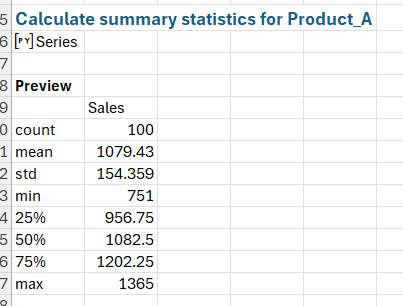
“Provide me summary statistics about the data that might be interesting.”
In response, Copilot generates a comprehensive set of summary statistics, organized by product category. These statistics include metrics such as the mean, median, standard deviation, minimum, and maximum values for each product, offering a detailed snapshot of the dataset’s distribution.
Now let’s get started with more advanced analysis by giving Coplot the prompt:
“Using this data, create a ARIMA model to predict the sales of each product.”
Copilot initiates the analysis by ensuring the data meets the requirements for time series modeling, starting with a stationarity check using the Augmented Dickey-Fuller test.
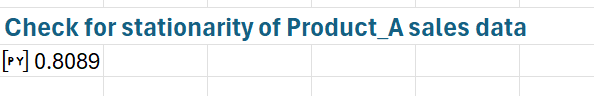
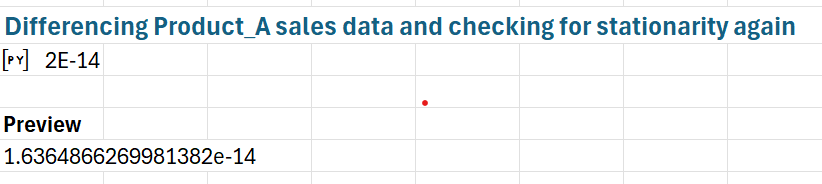
It not only identifies that the data is non-stationary, but also takes the corrective action of differencing the data to achieve stationarity. This essential preprocessing step prepares the dataset for effective modeling.
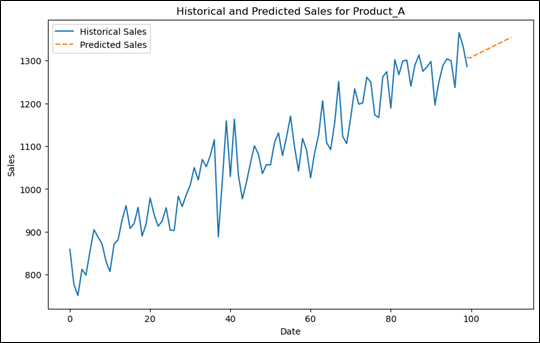
With the data ready, we build an ARIMA model using parameters (1, 1, 1), representing one AutoRegressive (AR) term, one Differencing (I) term, and one Moving Average (MA) term. Copilot generates and fits the model, producing a SARIMA (Seasonal ARIMA) version tailored to the data’s seasonal characteristics. This model effectively captures the underlying sales trend and periodic fluctuations. Following this, Copilot prompts for further analysis, allowing us to forecast sales for the next 12 months. It calculates the predictions and creates a visualization that overlays historical data with the forecasted values, highlighting expected growth and seasonal variations.
We have done extensive analysis to get to this point by only using prompts. Let’s further our analysis by getting suggestions from Copilot.
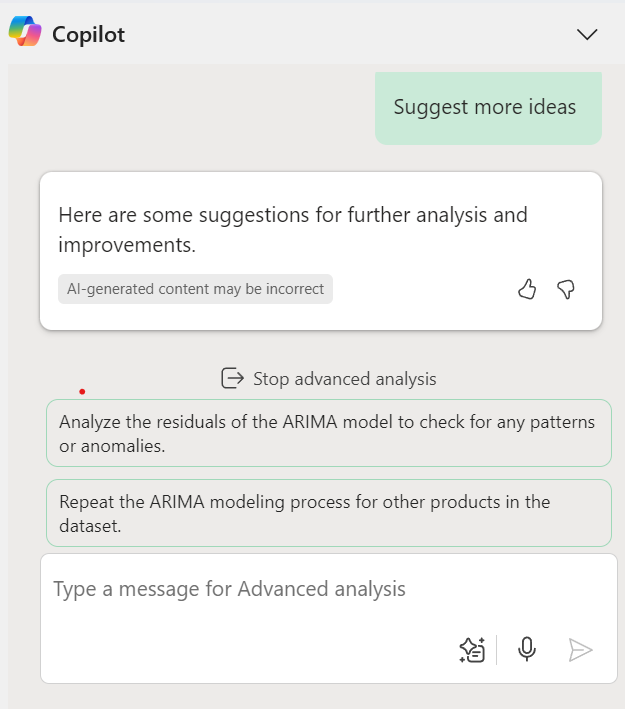
You can see that Copilot suggests other analysis, and offers to repeat the analysis for the other products in the dataset.
This workflow demonstrates how Copilot in Excel with Python make advanced forecasting accessible to users without deep technical expertise. Businesses can improve inventory management by predicting demand, enhance financial planning by setting realistic revenue targets, and optimize promotions by identifying high-demand periods.
The integration of Copilot and Python in Excel represents a transformative leap in data analysis and workflow optimization. This powerful combination bridges the gap between traditional spreadsheet functionality and advanced programming capabilities, enabling professionals to unlock new levels of productivity and insight. From automating repetitive tasks to conducting sophisticated analyses like K-Means clustering, these tools empower users to streamline processes, uncover patterns, and make informed decisions with ease.
The sales forecasting example highlights how this synergy can be leveraged to analyze sales data, extract actionable insights, and tailor strategie. By using Python’s robust libraries and Copilot’s AI-driven assistance, even complex tasks become intuitive and efficient. Visualizations and narratives generated during the analysis further enhance understanding and enable data-driven strategies.
For data-driven industries, these advancements offer an opportunity to better understand their customers, optimize offerings, and remain competitive in an increasingly digital landscape. With its seamless integration and user-friendly approach, Copilot in Excel with Python redefine what’s possible in spreadsheet analysis, making it an essential tool for professionals across all fields.