Master Python in Excel with Anaconda’s Python in Excel Cheat Sheet

By: Owen Price

We’re thrilled to announce the latest addition to Anaconda Toolbox: R language support in Anaconda Code! With this beta release, you can now harness the statistical power and visualization capabilities of R directly within your Excel worksheets, giving you even more flexibility in your data analysis toolkit. Let’s explore a practical example that showcases how this integration can revolutionize your data workflows.
With this powerful addition, Anaconda Code users can now script in both Python and R in the same Excel workbook, combining the two biggest data science languages with the world’s most popular productivity tool.

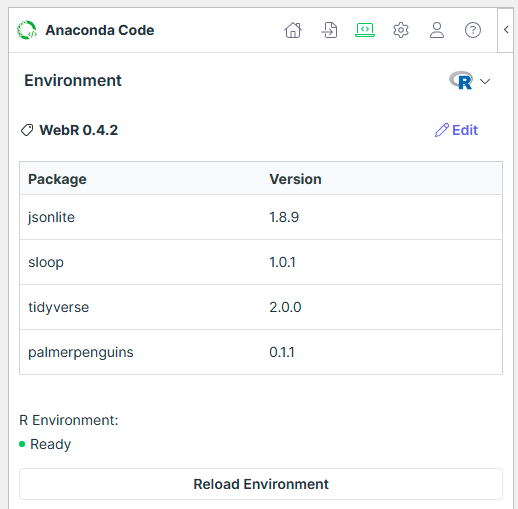
Anaconda Code means you can install R libraries directly into an R environment in your workbook, allowing you to choose from over 20k libraries to upgrade your statistical workflows. The environment is managed locally in the add-in, meaning your data stays in the workbook at all times.

Consider a common challenge in data analysis: performing advanced statistical tests that go beyond Excel’s built-in functions. While Excel offers basic statistical tools, R is renowned for its comprehensive statistical capabilities. Now, you can access these powerful tools without leaving your Excel environment.
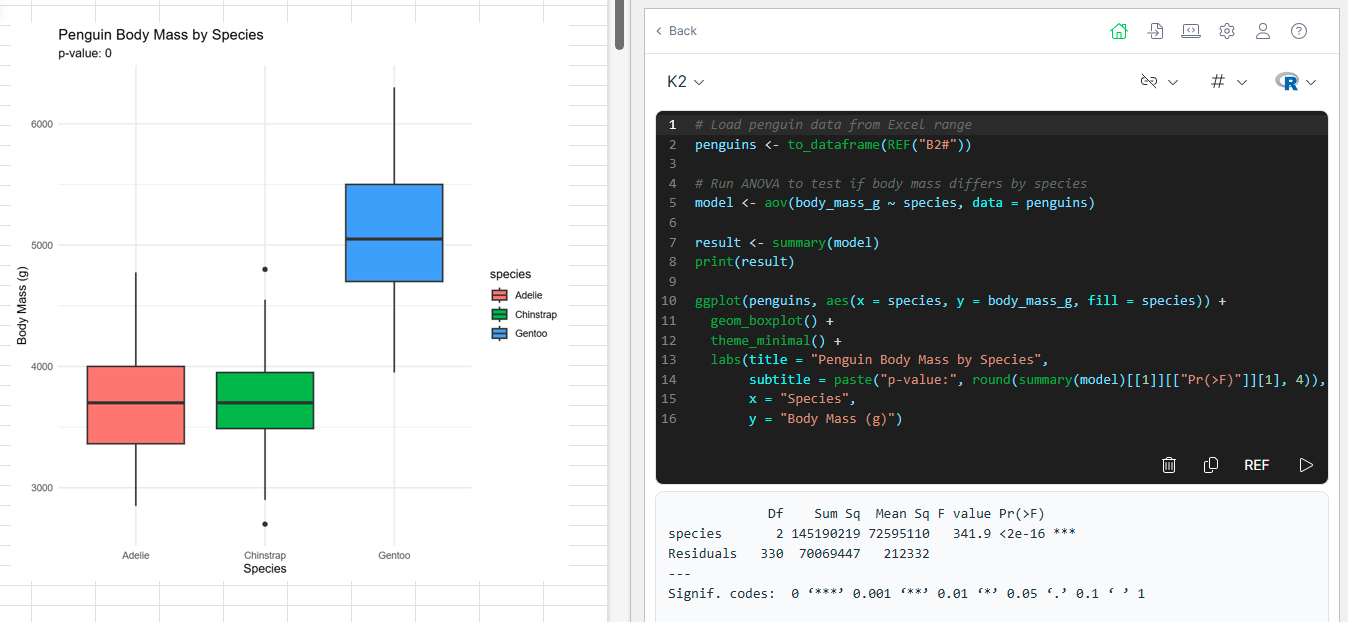
Anaconda Code’s REF function passes worksheet data directly into the R script where we can easily perform a one-way analysis of variance, printing the statistics to the cell’s log and returning a boxplot to the worksheet.

Complementary Strengths: Combine R’s statistical prowess with Excel’s accessibility and familiar interface
Seamless Data Flow: Work with Excel ranges directly in R without exporting or importing files
Enhanced Visualizations: Create publication-quality graphics with ggplot2 and other R visualization packages
Statistical Depth: Access R’s extensive ecosystem of statistical packages directly from your spreadsheet
Local Execution: Scripts run locally in your secure Anaconda Code environment
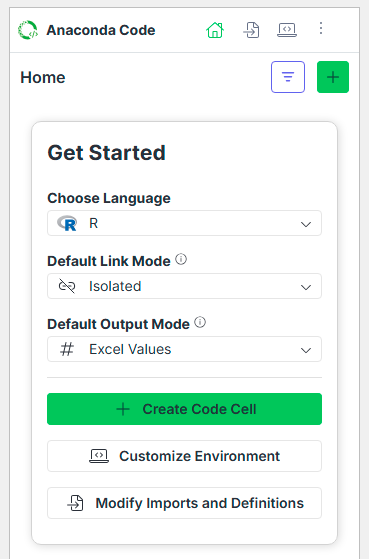
Using R in Anaconda Code is straightforward:
The addition of R to Anaconda Code opens up exciting new possibilities for data professionals and analysts:
For Data Scientists: Continue using your preferred R packages and workflows while collaborating with colleagues who use Excel
For Excel Power Users: Access advanced statistical techniques without leaving your spreadsheet
For Data Analysts: Choose the right tool for each specific analysis—Python, R, or Excel—all in one environment
For Researchers: Apply rigorous statistical methods to your data using R’s specialized packages
What makes this integration particularly powerful is the ability to use both Python and R in the same workbook. Different analyses might benefit from the strengths of each language—use Python’s machine learning capabilities alongside R’s statistical functions, all within your Excel workflow.
Ready to elevate your Excel data analysis with the power of R? Install Anaconda Toolbox for Excel and begin exploring the possibilities of R integration today!