6 Considerations for Developing AI for Manufacturing

Anaconda Team
By: Jose Mesa and Matthew Kramer

Green energy technology development has gained a lot of traction in recent years due to its effectiveness in reducing carbon footprints while also meeting energy consumption needs. Studies have shown that diversity of thought leads to optimal solutions; taking this analogy to the energy space, we seek to attain a balance that both satisfies demand and reduces climate impact by combining different technologies and optimizing amongst all energy sources. This post explores how the tech industry has become a bridge between green and conventional energy sources, helping to reduce carbonization and its consequences for our global environment. We also look at the U.S. Wind Turbine Database and demonstrate how data science tools like Anaconda data catalogs can be used for energy process optimization.
Breakthroughs in data science, artificial intelligence (AI), machine learning (ML), and computer hardware are allowing for increasingly seamless processes and deployment of applications; thus, more and more industries are adopting technologies to drive greener efforts and reduce the carbon footprints associated with conventional energy sources.
Some companies, for example, are leveraging digital twins (digital representations of physical systems) to support more informed decision making. Digital models allow for virtual simulation, testing, and real-time optimization of processes, which in turn supports decarbonization via reduction in operating emissions. Digital twins also facilitate the evaluation of system integrity, which can then lead to life-cycle optimization (life extension), thereby reducing the need to decommission old structures/commission new ones and minimizing associated building materials, costs, and physical impact. Digital twins reflect just one way energy-savvy teams are leveraging new technologies to tap into big data and create models that predict optimized operations in various scenarios, ultimately delivering more cost-effective and environmentally-friendly solutions.
Several industries are leaning into greener solutions beyond enhancement and optimization or traditional energy sources. Known green energy sources include solar energy, wind turbines, wave-induced energy, and more recently, renewable fuel from feedstocks. Let’s take a closer look at the wind turbine industry and how technology can impact the field.
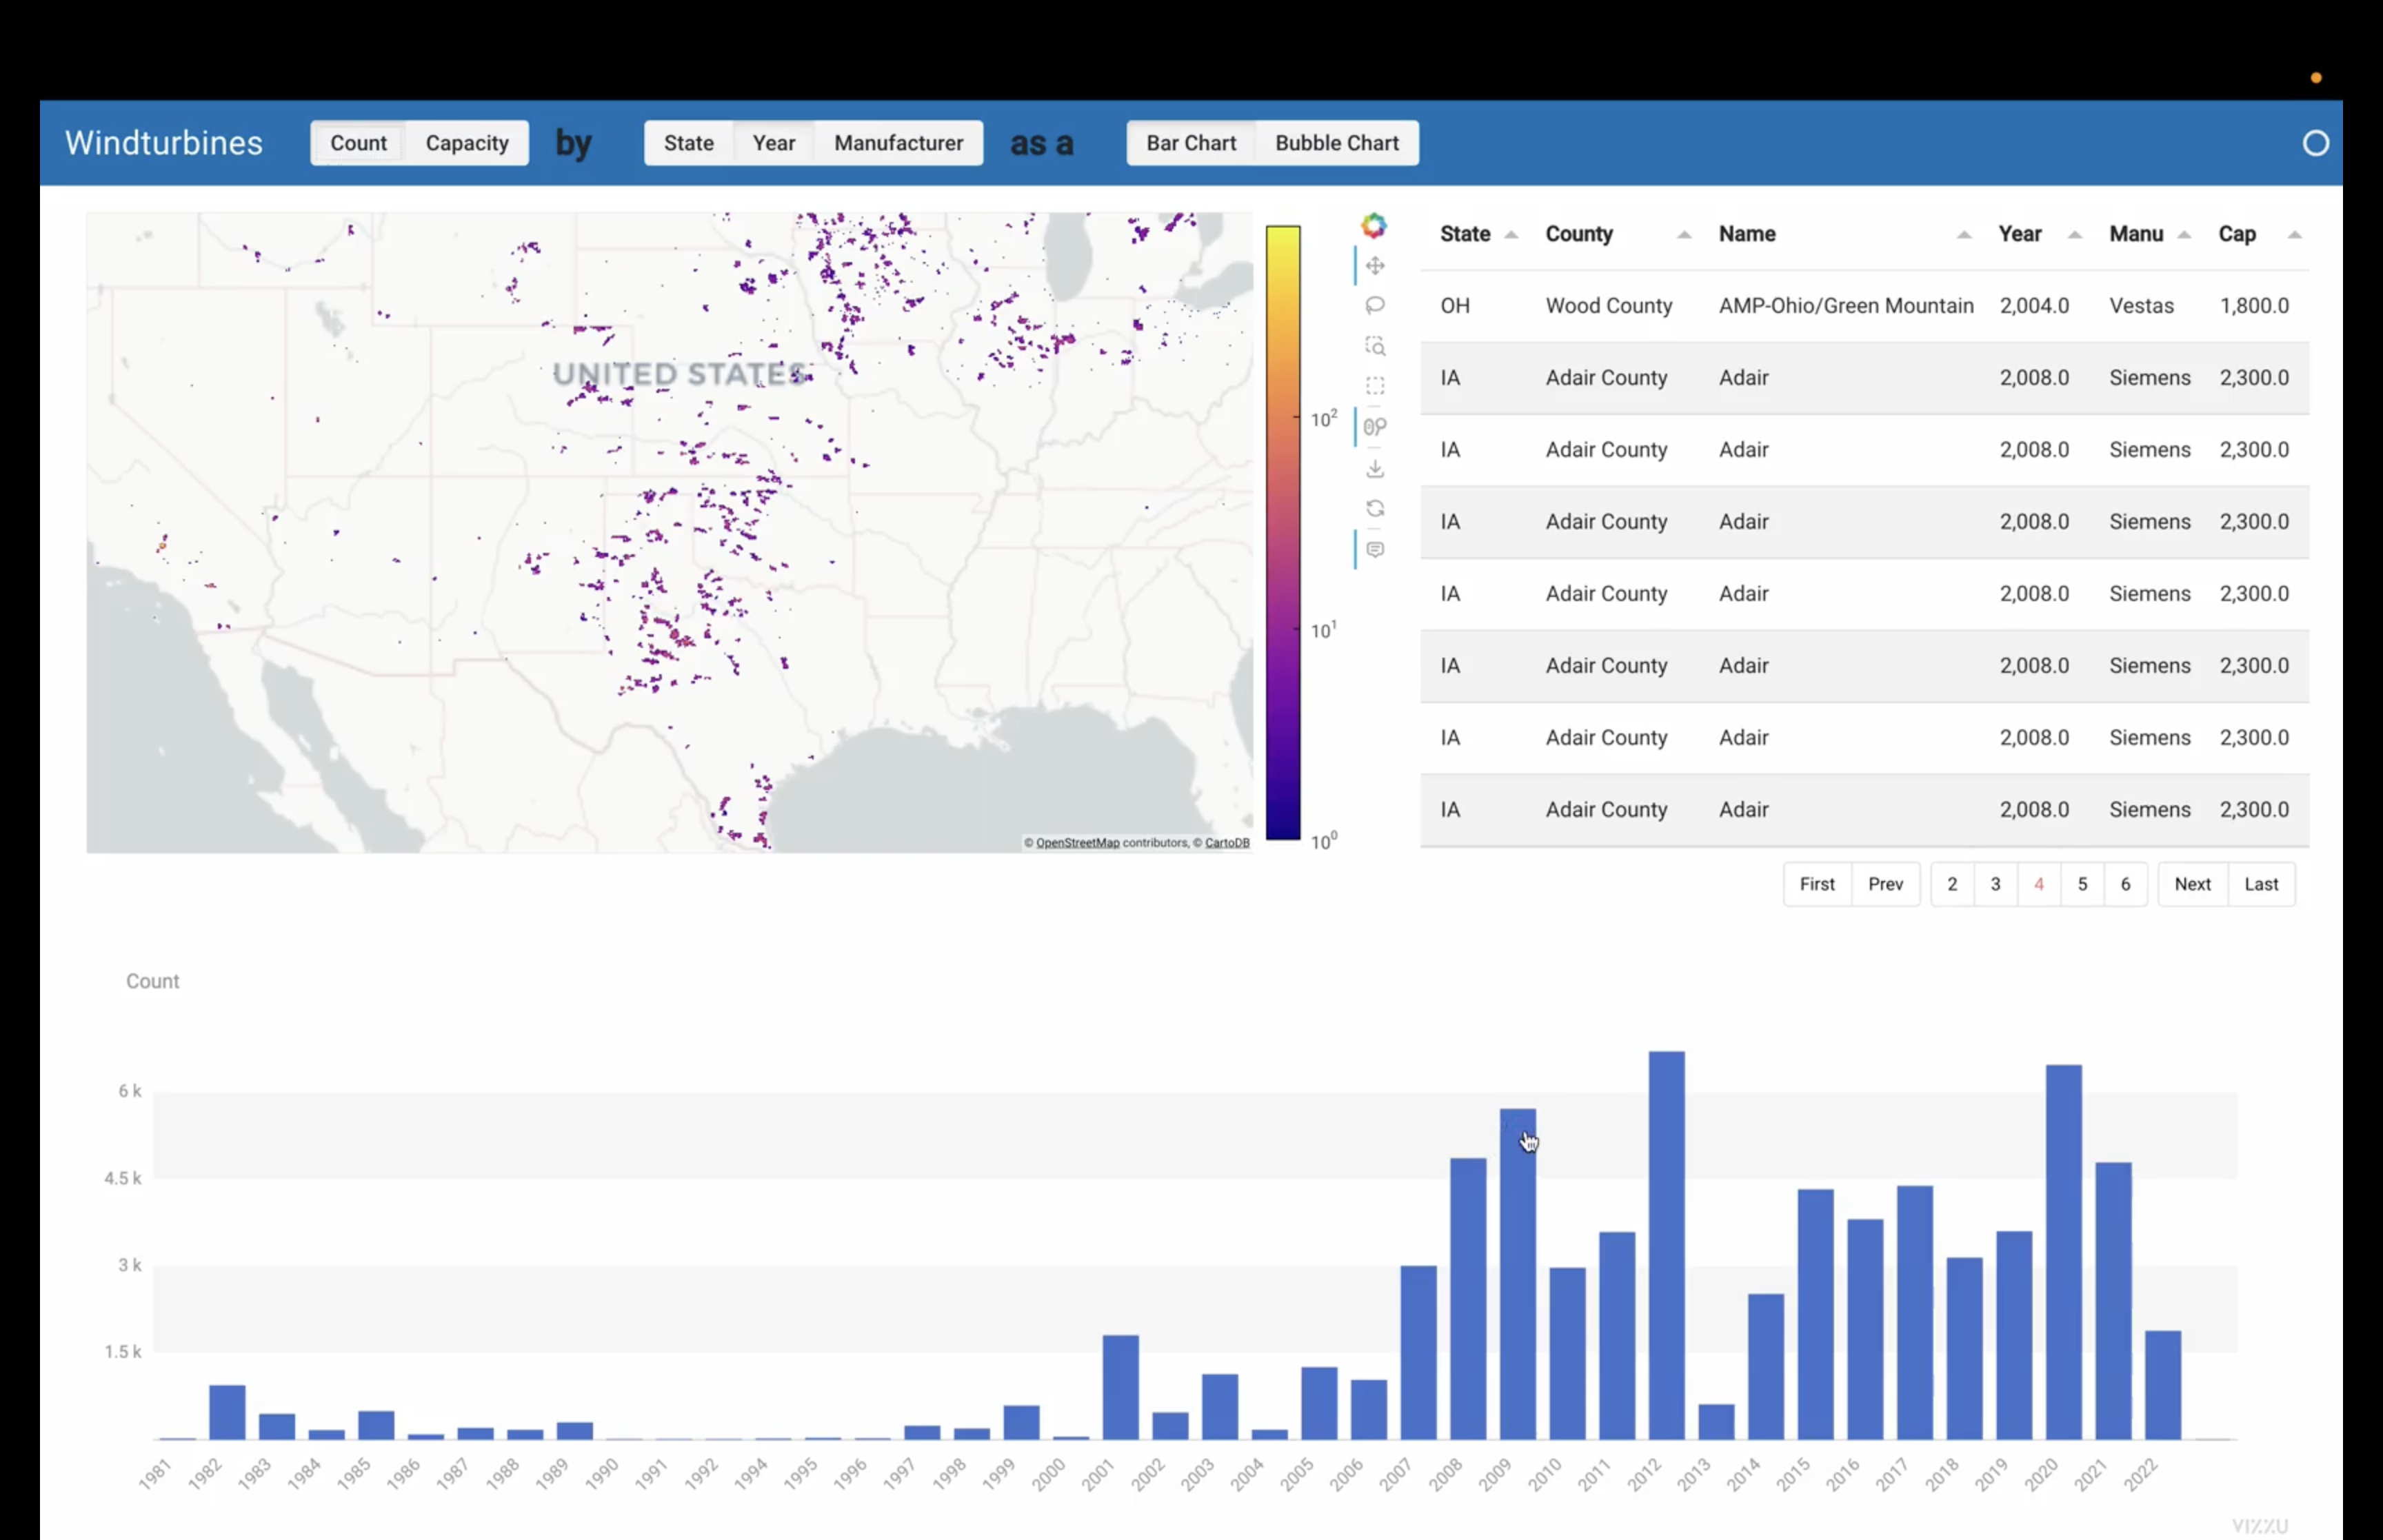
The United States Geological Survey (USGS) deployed a U.S. wind turbine dashboard that allows users to screen wind turbine data based on location, height, capacity, and installation year and visualize this data in a geographical view. This visual representation enables users to quickly ascertain trends and understand wind turbine capacity and performance, which supports future decision making. Big data visualization is a clear example of how the tech industry is embedded in the renewable energy industry.
The USGS wind turbine database is open and shareable, which is conducive to deeper analysis and the implementation of ML algorithms to generate predictive models. The first step in any ML or visualization process is to locate a data source and structure it in a way that allows for analysis, visualization, or model generation.
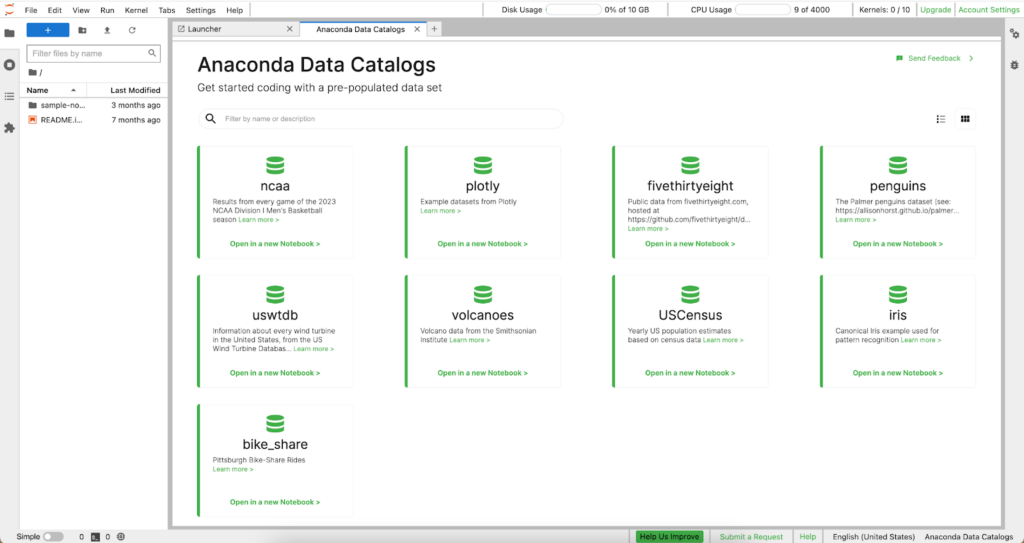
In keeping with Anaconda’s vision of empowering the world with data literacy, we recently deployed a new feature: data catalogs. Anaconda data catalogs leverage Intake to allow users to easily find and load interesting real-world data sets. The USGS wind turbine data has been incorporated into our data catalogs for easy access.
In the following demo video, we deploy a Panel dashboard using a Jupyter notebook that leverages Anaconda data catalogs to quickly analyze the U.S. wind turbine data set and compare count and capacity by state. The dashboard also allows us to analyze wind turbine count and capacity by manufacturer and provides insight into the growth of wind turbines and their capacity throughout the years. The demo shows just how easy it is to manipulate the data set and provide a quick understanding of wind turbine trends via dashboard visualization—this then empowers stakeholders to plan and make informative decisions around future installations, which clearly communicates the advantages of this technology.
Anaconda data catalogs integrate real-world data sets with our ready-to-code cloud notebooks. Simply create or sign in to your Anaconda Nucleus account to experiment with our ever-growing selection of data sets.

As our U.S. wind turbine data and Anaconda data catalogs demo indicates, technology and data science tools, specifically, can empower green energy initiatives in a multitude of ways. Here are a few key takeaways:
Interested in data science, energy, and our climate? Check out these other resources:
Jose Mesa is a Senior Software Engineer at Anaconda who supports development, data science, modeling, analytics, and educational partnerships (outreach). Before joining Anaconda, Jose was a Facilities Engineer in Chevron’s Subsea, Civil, and Marine Engineering unit, where he integrated data science techniques into the design optimization, analysis, and real-time monitoring of offshore structures. He received his Ph.D. from the University of Michigan Naval Architecture and Marine Engineering (NA&ME) department and holds two Master of Science in Engineering (MSE) degrees, in Aerospace Engineering and NA&ME. He completed his dual Bachelor’s in Civil Engineering and Land Surveying at the University of Puerto Rico.
Matthew Kramer is a Staff Software Engineer at Anaconda supporting the development of cloud practitioner tools for data science, modeling, and analytics. Before joining Anaconda, Matt spent 8 years as a Facilities Engineer in Chevron’s Deepwater Support Center where he integrated data science techniques into the design optimization, analysis, and real-time monitoring of offshore structures. He also has an extensive background in the application of Computational Fluid Dynamics to offshore floating structures. He received his Ph.D., M.S.E, and B.S.E. in Naval Architecture and Marine Engineering from the University of Michigan.
Talk to one of our experts to find solutions for your AI journey.