Create an interactive plot
-
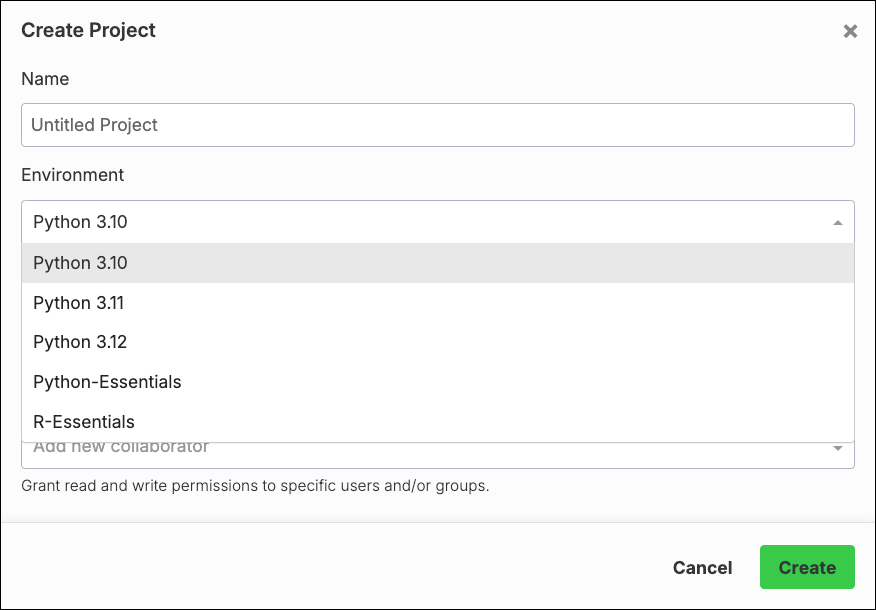
From the Projects view, create a new project using the minimal Python templates:
- Open a session for your newly created project.
- Open a terminal.
-
Run the following command to install
hvplotandpanel: -
Create a new Notebook and rename it to
tips.ipynb. -
Add the following code to
tips.ipynb:In this example, the data is being read from the Internet. Alternatively, you could download the.csvand upload it to the project. -
Open the project’s
anaconda-project.ymlfile, and add the following deployment command: - Save and commit your changes.
- Deploy the project.