Traditionally, finance professionals have relied heavily on Microsoft Excel as a go-to tool for tasks like financial modeling, budgeting, forecasting, and data analysis. Excel’s strength lies in its versatility and ability to handle large datasets, perform complex calculations, and create reproducible models that are easily shared across teams. Whether it’s used for managing budgets, forecasting revenue, or building intricate financial models, Excel has been the cornerstone of day-to-day financial operations. Its user-friendly interface, combined with powerful features like pivot tables, data visualization tools, and a wide range of built-in functions, has made it indispensable in the finance world.
In a similar manner, Python has emerged as one of the dominant programming languages in finance, thanks to its robust, out-of-the-box functionality and vast array of libraries tailored for financial analysis. Python’s flexibility and extensive library ecosystem, including pandas, NumPy, and Matplotlib, have empowered finance professionals to conduct sophisticated data analysis, automate repetitive tasks, and create dynamic financial models. Python’s ability to perform data manipulation and integrate seamlessly with other systems has made it a favorite among those looking to push the boundaries of financial analysis.
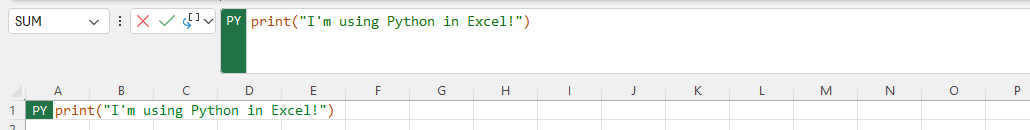
What if we could combine Excel’s accessibility with the batteries-included mentality of Python? Now, you can with Python in Excel. By simply typing ‘=PY’ Excel users can integrate Python directly into their spreadsheets. This fusion allows users to leverage Python’s advanced capabilities while continuing to work within the familiar environment of Excel. The integration of Python into Excel means that tasks that previously required external scripts can now be performed directly within Excel using something finance professionals already know, Python.
Get Started with Python in the Grid
To get started with Python in Excel, simply type ‘=PY(’. As soon as you type the open parenthesis, a green bar will appear on the left side of the cell and the formula bar, indicating you are in Python-cell editing mode. This enhancement to Excel’s native formula bar allows you to seamlessly combine the power of Python with the familiarity of Excel. You can easily select cells, apply Python functions directly to your data, and use the Python packages loaded into the environment provided. Whether you are leveraging pandas for data manipulation, Matplotlib for visualization, or any other Python library, this editor brings the full power of Python right into your Excel workflow, making it easier than ever to enhance your financial models and analyses.
Once you have finished writing your Python script within Excel, executing it is as simple as hitting Ctrl + Enter on your PC. Executing a Python cell sends the code in the cell to the Python runtime where it is interpreted and executed before the data are returned to the workbook. You also have the flexibility to decide how the output of each cell should be treated—whether as a Python object, like a pandas DataFrame or function, or simply as a value.
Imagine the possibilities: no more struggling with a spreadsheet or model that is too complex for Excel alone but does not quite warrant a separate Python script. Traditionally you would have used VBA macro, but lose out on the Python libraries you use everyday. Now, you can have the best of both worlds, blending Excel’s ease of use with Python’s built-in functions.
Here are a few examples of common calculations to see how Python in Excel can revolutionize financial analysis.
Computing Returns
For finance professionals who regularly work with stock prices, bonds, or any form of time series data, calculating returns is a routine yet essential task. Returns, whether simple or compounded, provide critical insights into the performance of investments over time. Traditionally, this task would involve creating complex Excel formulas that could be cumbersome, especially when dealing with large datasets or frequent updates.
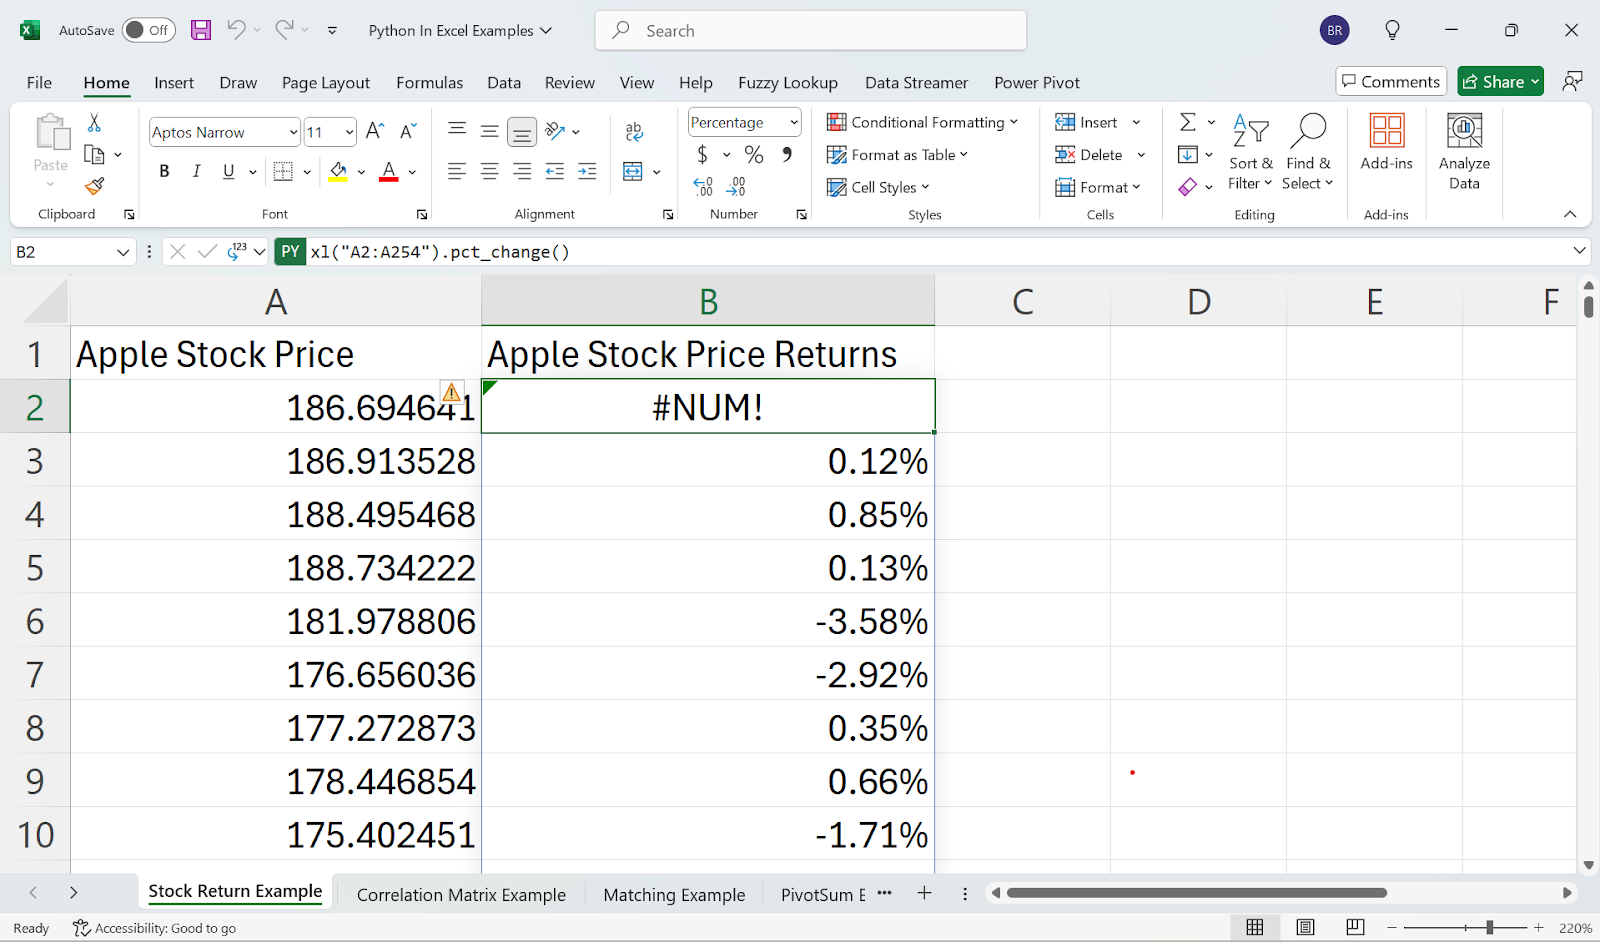
However, with the integration of Python’s pandas package into Excel, this process has become significantly more streamlined and efficient. Pandas allows you to treat any Excel range as if it were a DataFrame—a powerful data structure in Python that simplifies data manipulation. This means you can easily compute returns on a series of prices using the .pct_change() function, which calculates the percentage change between the current and a prior element in the data series.
Streamlining Correlation and Covariance Calculations
For finance professionals involved in portfolio management, risk assessment, or optimization work, calculating correlation and covariance matrices is a fundamental yet often tedious task. We all know the hassle of filling in the “other half” of the correlation or covariance matrix. These matrices are critical for understanding the relationships between different assets, identifying diversification opportunities, and optimizing portfolios to achieve the best risk-return balance. Traditionally, filling in these matrices manually in Excel can be time-consuming and prone to errors, especially when dealing with large datasets or frequent updates.
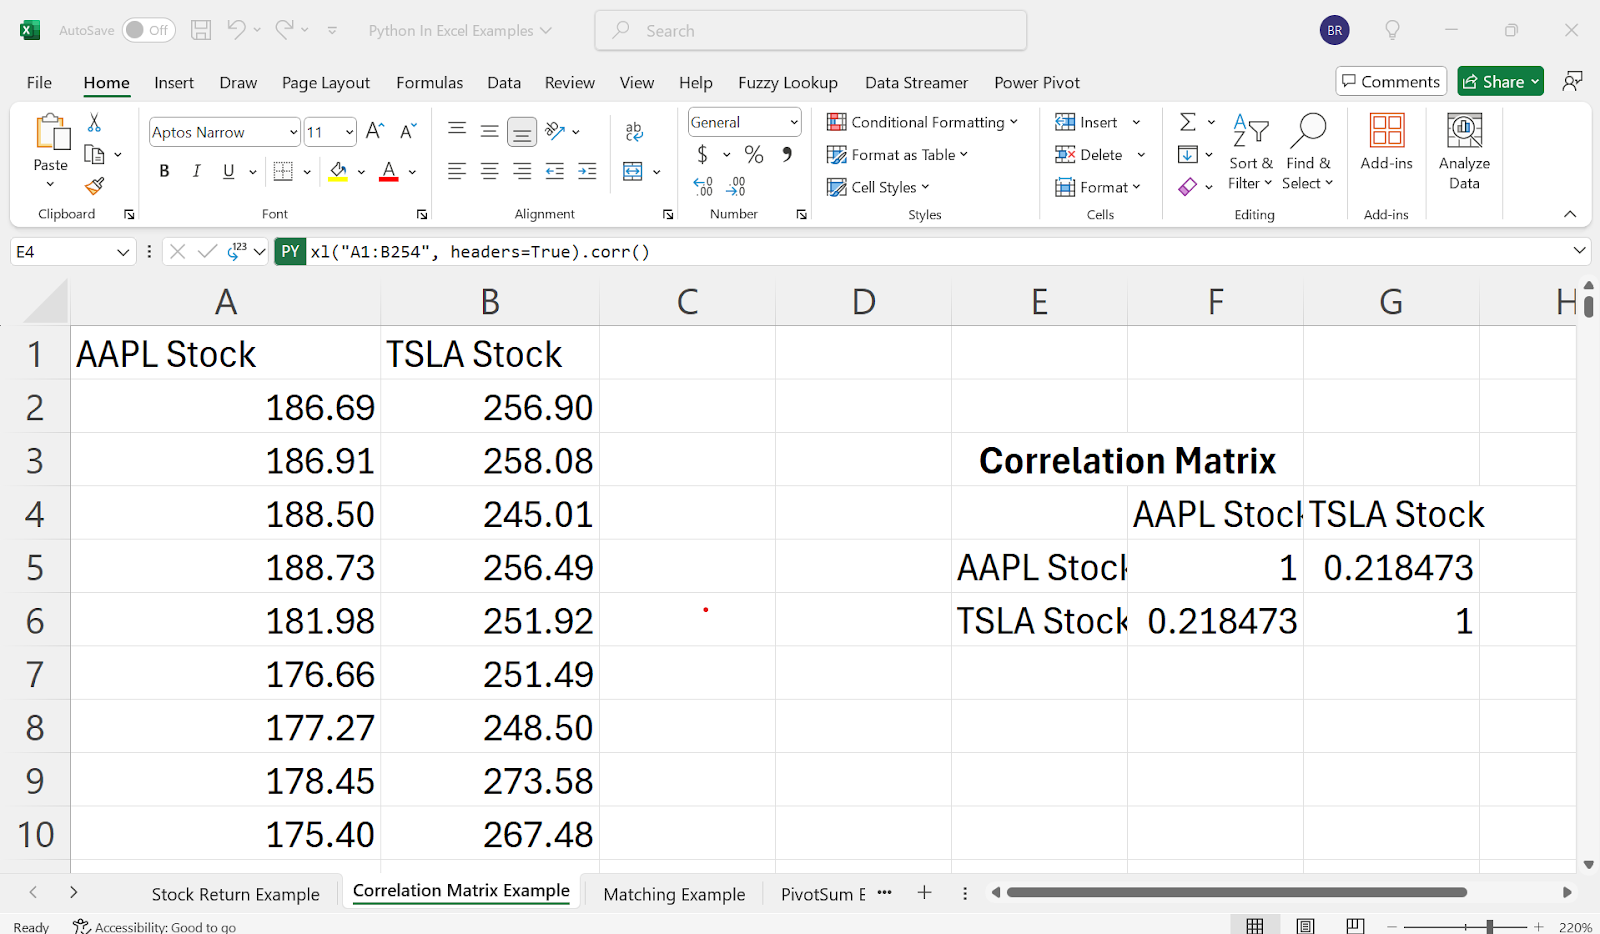
With the integration of Python into Excel, this process has been dramatically simplified. By treating your data as a DataFrame using pandas, you can now compute correlation and covariance matrices with just a few lines of code. The .corr() function in pandas, for example, allows you to generate a complete correlation matrix effortlessly, capturing the pairwise correlations between all variables in your dataset.
Matching (Replacing Index-Match)
Matching data across different sheets or datasets is a common yet challenging task in Excel, often requiring the use of the complex and error-prone INDEX and MATCH functions. Whether you are aligning financial records, merging datasets from different sources, or consolidating data for analysis, this process can be time-consuming and frustrating, especially when working with large and complex datasets.
With the integration of Python into Excel, this task becomes significantly easier and more efficient. Using pandas, you can replace the traditional INDEX-MATCH method with the much more powerful and intuitive pd.merge() function. This function allows you to effortlessly combine data from different sheets or even different notebooks, handling the alignment and merging of data with precision and speed.
For instance, if you need to match transactions from one sheet with corresponding data from another, pd.merge() can quickly and accurately link these datasets based on common fields, such as dates or transaction IDs. This not only simplifies the process, but also reduces the risk of errors that can arise from manually linking data.

Pivot, in One Line
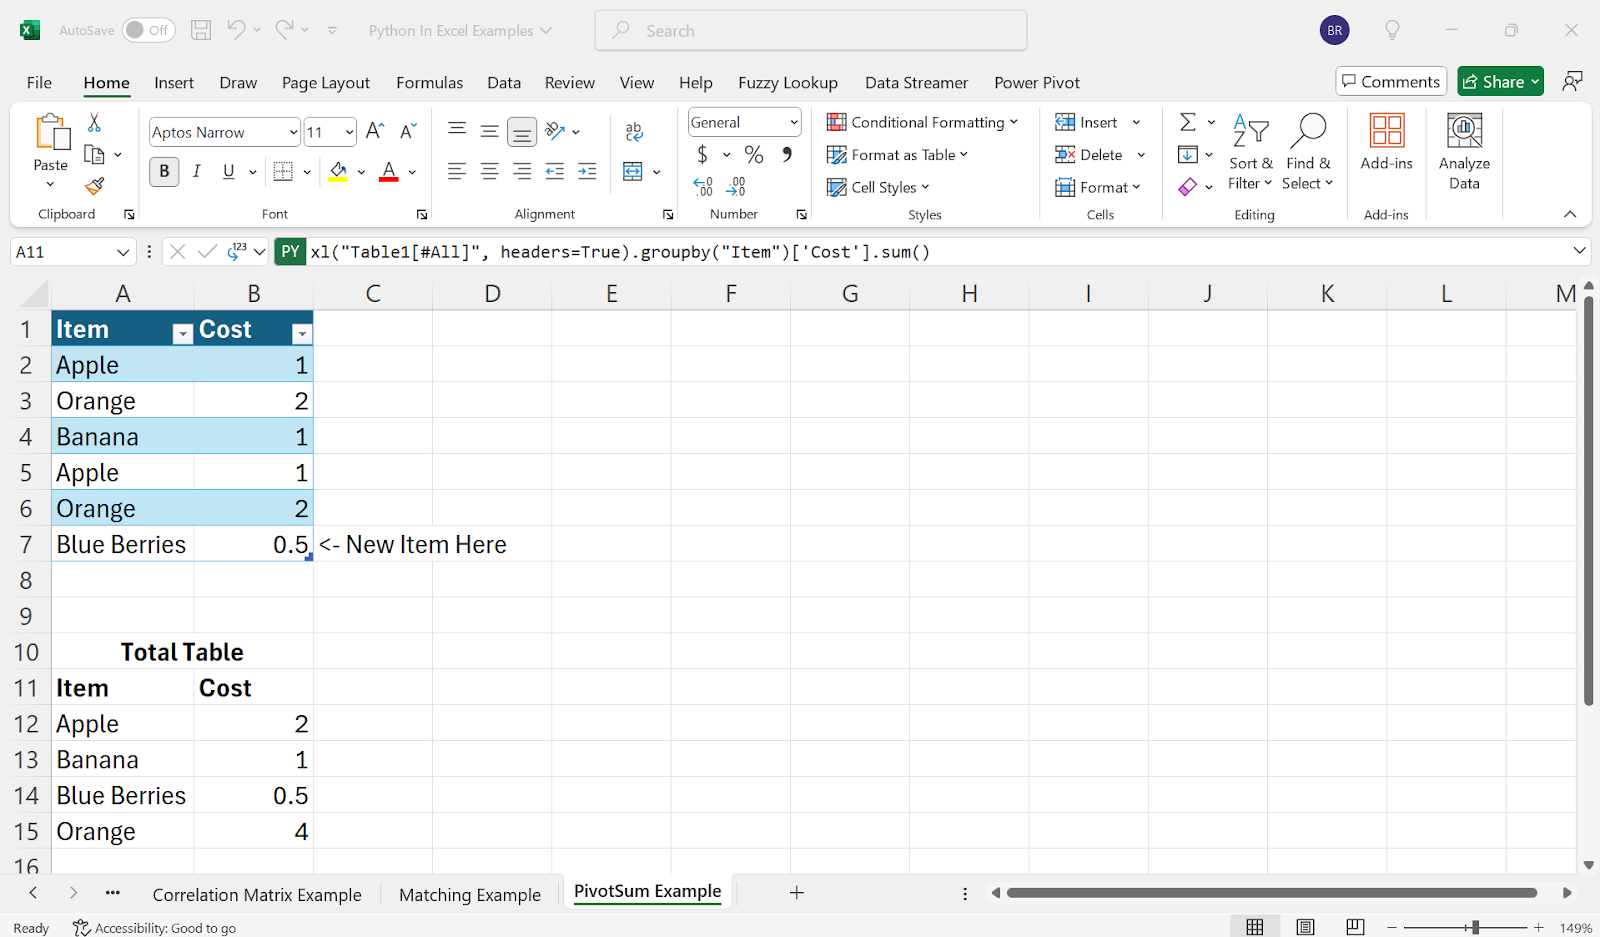
If you have ever needed to create a pivot table in Excel to sum data based on an ID or another key field, you know how cumbersome it can be, especially when dealing with multiple sheets or trying to maintain the accuracy of complex aggregations. While Excel’s pivot tables are powerful, they can sometimes be inflexible, requiring manual updates or additional steps when your data changes or expands.
With the integration of Python into Excel, these limitations are no longer an issue. Using pandas, you can easily group and aggregate data directly within a single cell, without the need to manage multiple sheets or manually update your pivot tables. The groupby() function in pandas allows you to perform these operations with incredible efficiency, enabling you to sum, count, or average data based on an ID or any other criteria in one line code.
For example, if you need to group transactions by Item ID and sum their total cost, you can do this directly in Excel using Python, and the result will automatically update as new data is added. This means you can keep your analysis dynamic and up-to-date without the hassle of reconfiguring pivot tables or manually aggregating data. See Figure X.

We can even manipulate or add a new item to the table and the table will update automatically, saving us time and space. See Figure X.
The integration of Python into Excel is a game-changer for finance professionals, offering a new level of power and flexibility in data analysis, modeling, and automation. By combining Excel’s familiar, user-friendly interface with Python’s robust computational abilities, you can now tackle tasks that were once tedious, time-consuming, or even impossible within traditional Excel alone. Whether you are simplifying return calculations, streamlining correlation matrices, or replacing complex INDEX-MATCH functions, Python in Excel makes these processes faster, easier, and more efficient.
This powerful combination does not just make your work easier, it transforms the way you approach financial analysis. Automating repetitive tasks, ensuring your data stays up-to-date, and allowing for more complex, dynamic analysis, and increasing portability of your models are just a few of the benefits. With Python’s extensive library of tools now at your fingertips directly within Excel, you can push the boundaries of what is possible in your models and analyses, all while working within a tool you already know and trust.
In short, Python in Excel is not just about adding a new feature, it is about elevating your entire workflow. It empowers you to handle more complex tasks with ease, stay more productive, and make better, data-driven decisions. As the world of finance continues to evolve, this integration ensures that Excel remains a vital, adaptable tool in every financial professional’s toolkit. Check out Python for Excel for yourself, now generally available from Microsoft.
_________
Blake Rayfield is an Assistant Professor of Finance at the University of North Florida, with a demonstrated history of working in the higher education industry. He holds an M.S. in Financial Economics and a Ph.D. in Financial Economics from The University of New Orleans. He has published in several peer-reviewed journals, including the Journal of Financial Research, Quarterly Review of Economics and Finance, and the Review of Behavioral Finance, among others. His research interests are in Corporate Finance and Investments, and he incorporates Python and data visualization in all projects. You can find him here: LinkedIn | GitHub | ResearchGate | Personal Webpage.