For years, Excel has been the go-to tool for marketers and analysts, providing powerful capabilities for organizing data or generating reports. However, when it comes to more advanced data analysis tasks, Excel alone is not enough. Marketers often have to turn to third-party add-ins or entirely different platforms to get the job done.
That can change with the integration of Python in Excel. This powerful combination brings the advanced data-processing capabilities of Python directly into the familiar Excel interface, creating a seamless workflow for marketers and data analysts. You can now run sophisticated analyses (customer segmentation, churn prediction, or sentiment analysis) using Python. No more switching between platforms, exporting and importing data, or relying on clunky add-ins. Python brings a whole new level of functionality to Excel, unlocking advanced techniques that were previously out of reach.
In this blog post, we’ll explore several real-world examples of how Python in Excel can transform marketing analysis. From analyzing qualitative data like customer reviews to predicting customer churn and segmenting customers with clustering algorithms, we will show how these tools work in practice. By leveraging Python’s powerful libraries,marketers can uncover deeper insights, make data-driven decisions, and ultimately, achieve better business outcomes from a tool they already know and love.
To get started with Python in Excel, simply type ‘=PY(’. As soon as you type the open parenthesis, a Python editor will appear within Excel. This integrated editor allows you to easily select cells, apply Python functions directly to your data, and access Python packages as you would in a traditional Anaconda environment. Whether you are leveraging pandas for data manipulation, Matplotlib for visualization, or any other Python library, this editor brings the full power of Python right into your Excel workflow.
Analyzing Qualitative Data with Python in Excel
With the recent integration of Python in Excel, marketers and data analysts are no longer limited to crunching numbers or creating models. Imagine being a marketer for a restaurant, and collecting hundreds of reviews. Some are glowing, some are critical, but each contains valuable feedback that you want to capture and analyze. Traditionally, we would have to sift through these reviews manually, trying to find common themes or words:But we can now streamline this process by automating the analysis of such unstructured data.
Using Python to Visualize Restaurant Reviews
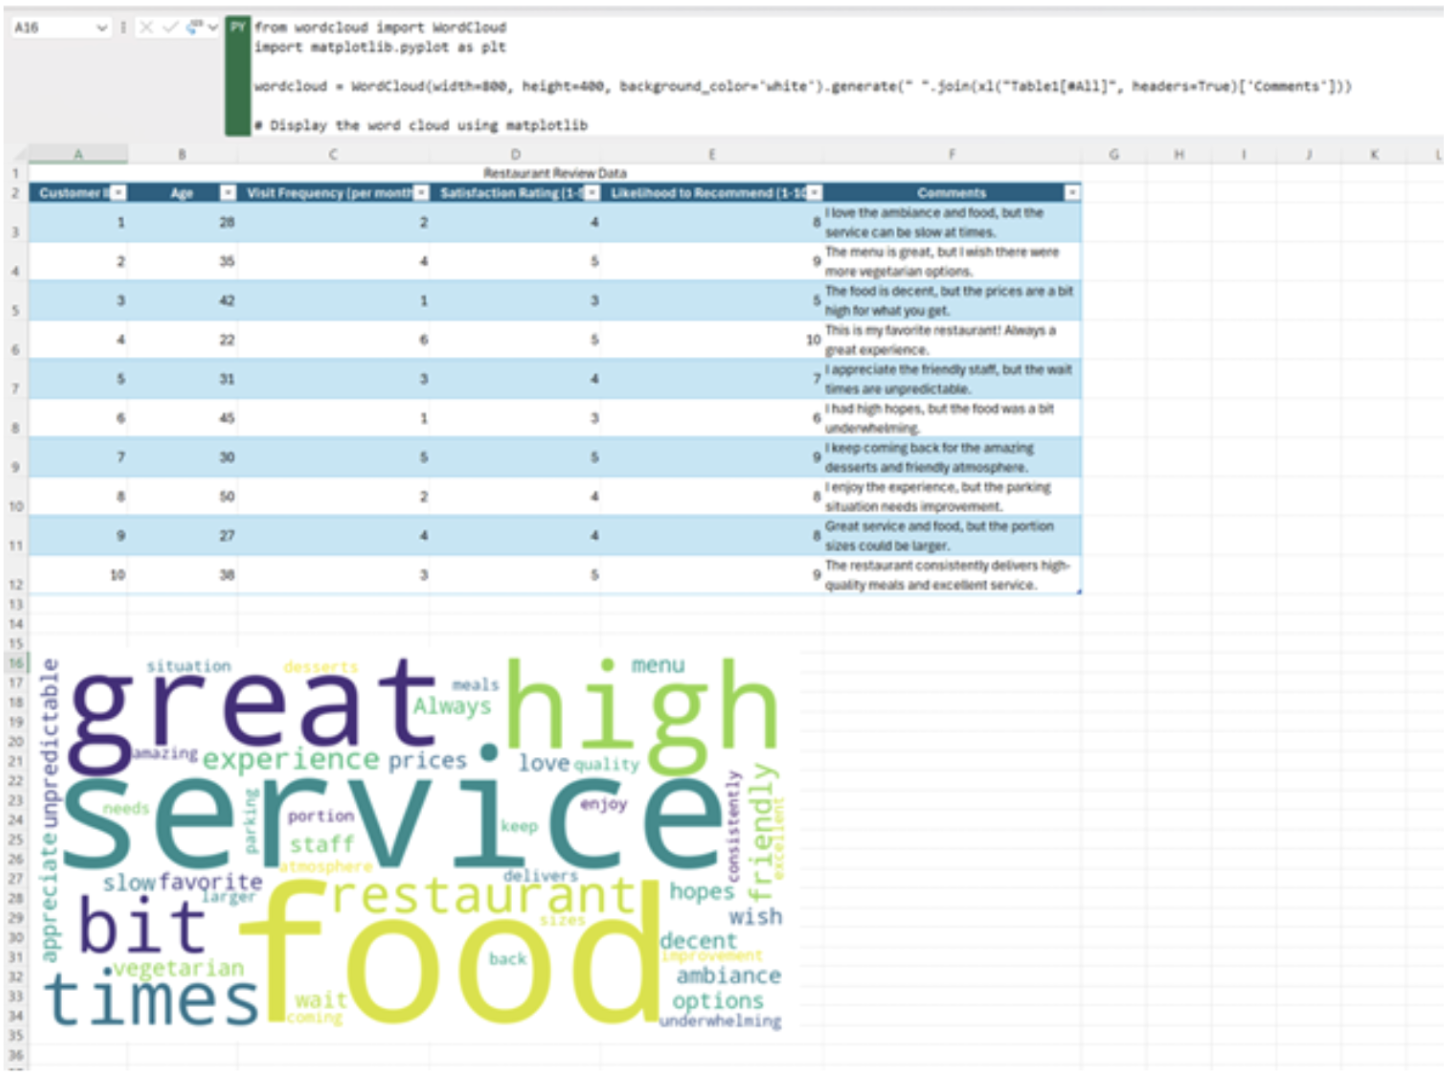
Let’s walk through an example using fictitious restaurant reviews. One powerful way to get insights from open-ended comments is by creating a word cloud. A word cloud visually highlights the most frequently mentioned words, making it easy to spot key themes.
from wordcloud import WordCloud
import matplotlib.pyplot as plt

wordcloud = WordCloud(width=800, height=400, background_color='white').generate(" ".join(xl("Table1[#All]",headers=True)['Comments']))

# Display the word cloud using matplotlib
plt.figure(figsize=(10, 5))
plt.imshow(wordcloud, interpolation='bilinear')
plt.axis("off")  # Hide the axes
plt.show()
In this example, we take advantage of Python in Excel’s ability to handle entire tables of data. Using the built-in wordcloud package, paired with matplotlib for visualization, we can effortlessly generate a word cloud from the reviews. This provides a quick snapshot of what customers are talking about the most—whether it’s the quality of the food, the ambiance, or the service.
This method is not only time-saving but also provides a more objective way to see patterns in qualitative data. You are no longer required to find a third-party add in or other workaround solution. Anyone can access these high impact tools directly from Excel.

Analyzing Customer Churn
Another valuable use case for marketers is analyzing customer churn—understanding how frequently customers are leaving, canceling subscriptions, or abandoning products. In the context of a SaaS product, analyzing churn can provide crucial insights into what factors are driving customer decisions, and ultimately help improve retention.
Let’s take a hypothetical dataset for a SaaS product. With Python in Excel, we can use statistical methods like logistic regression to identify which variables are influencing churn. For example, maybe the price of the subscription is pushing users away, or perhaps it’s the level of customer support they have received. By exploring these factors, we can develop strategies to retain customers more effectively.
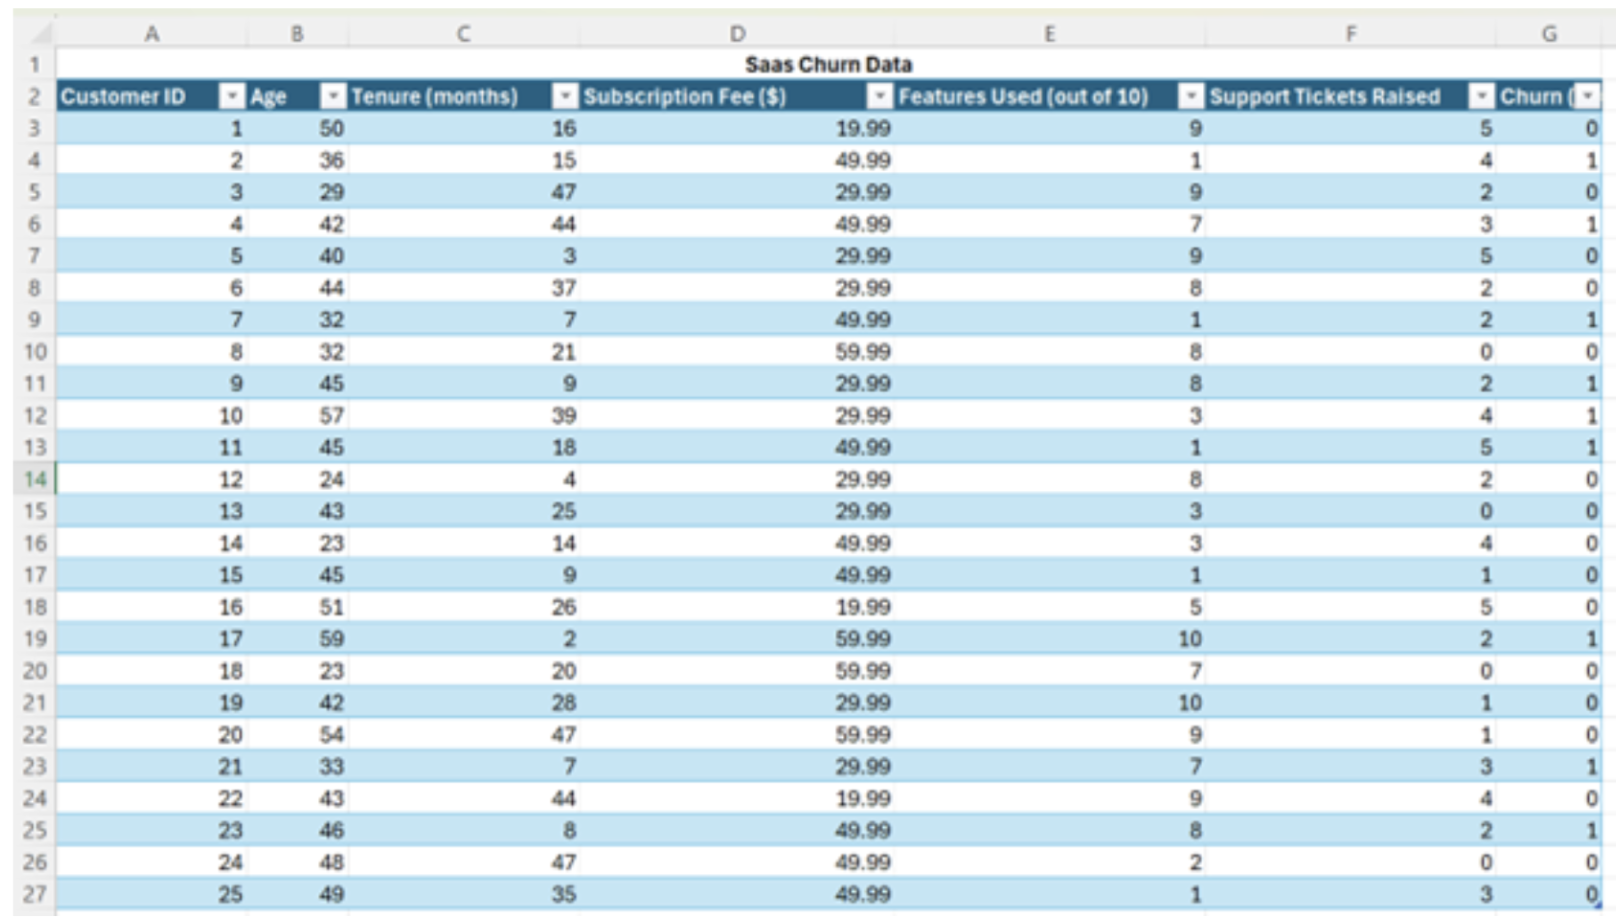
In this example, we’ll use Python’s statsmodels package, which is perfect for running logistic regression models within Excel. Logistic regression helps us predict the likelihood of a customer churning based on several factors—such as their tenure, how many features they use, or the number of support tickets they have raised. The goal is to identify which variables are strong predictors of churn, so we can take proactive measures.
import pandas as pd
import statsmodels.api as sm
# Convert to DataFrame
df = pd.DataFrame(xl("Table13[#All]", headers=True))
# Define dependent variable (Churn) and independent variables (Age, Tenure, Subscription Fee, Features Used, Support Tickets Raised)
X = df[['Age', 'Tenure (months)', 'Subscription Fee ($)', 'Features Used (out of 10)', 'Support Tickets Raised']]
y = df['Churn (1 = Yes, 0 = No)']
# Add constant term for the intercept
X = sm.add_constant(X)
# Fit a logistic regression model
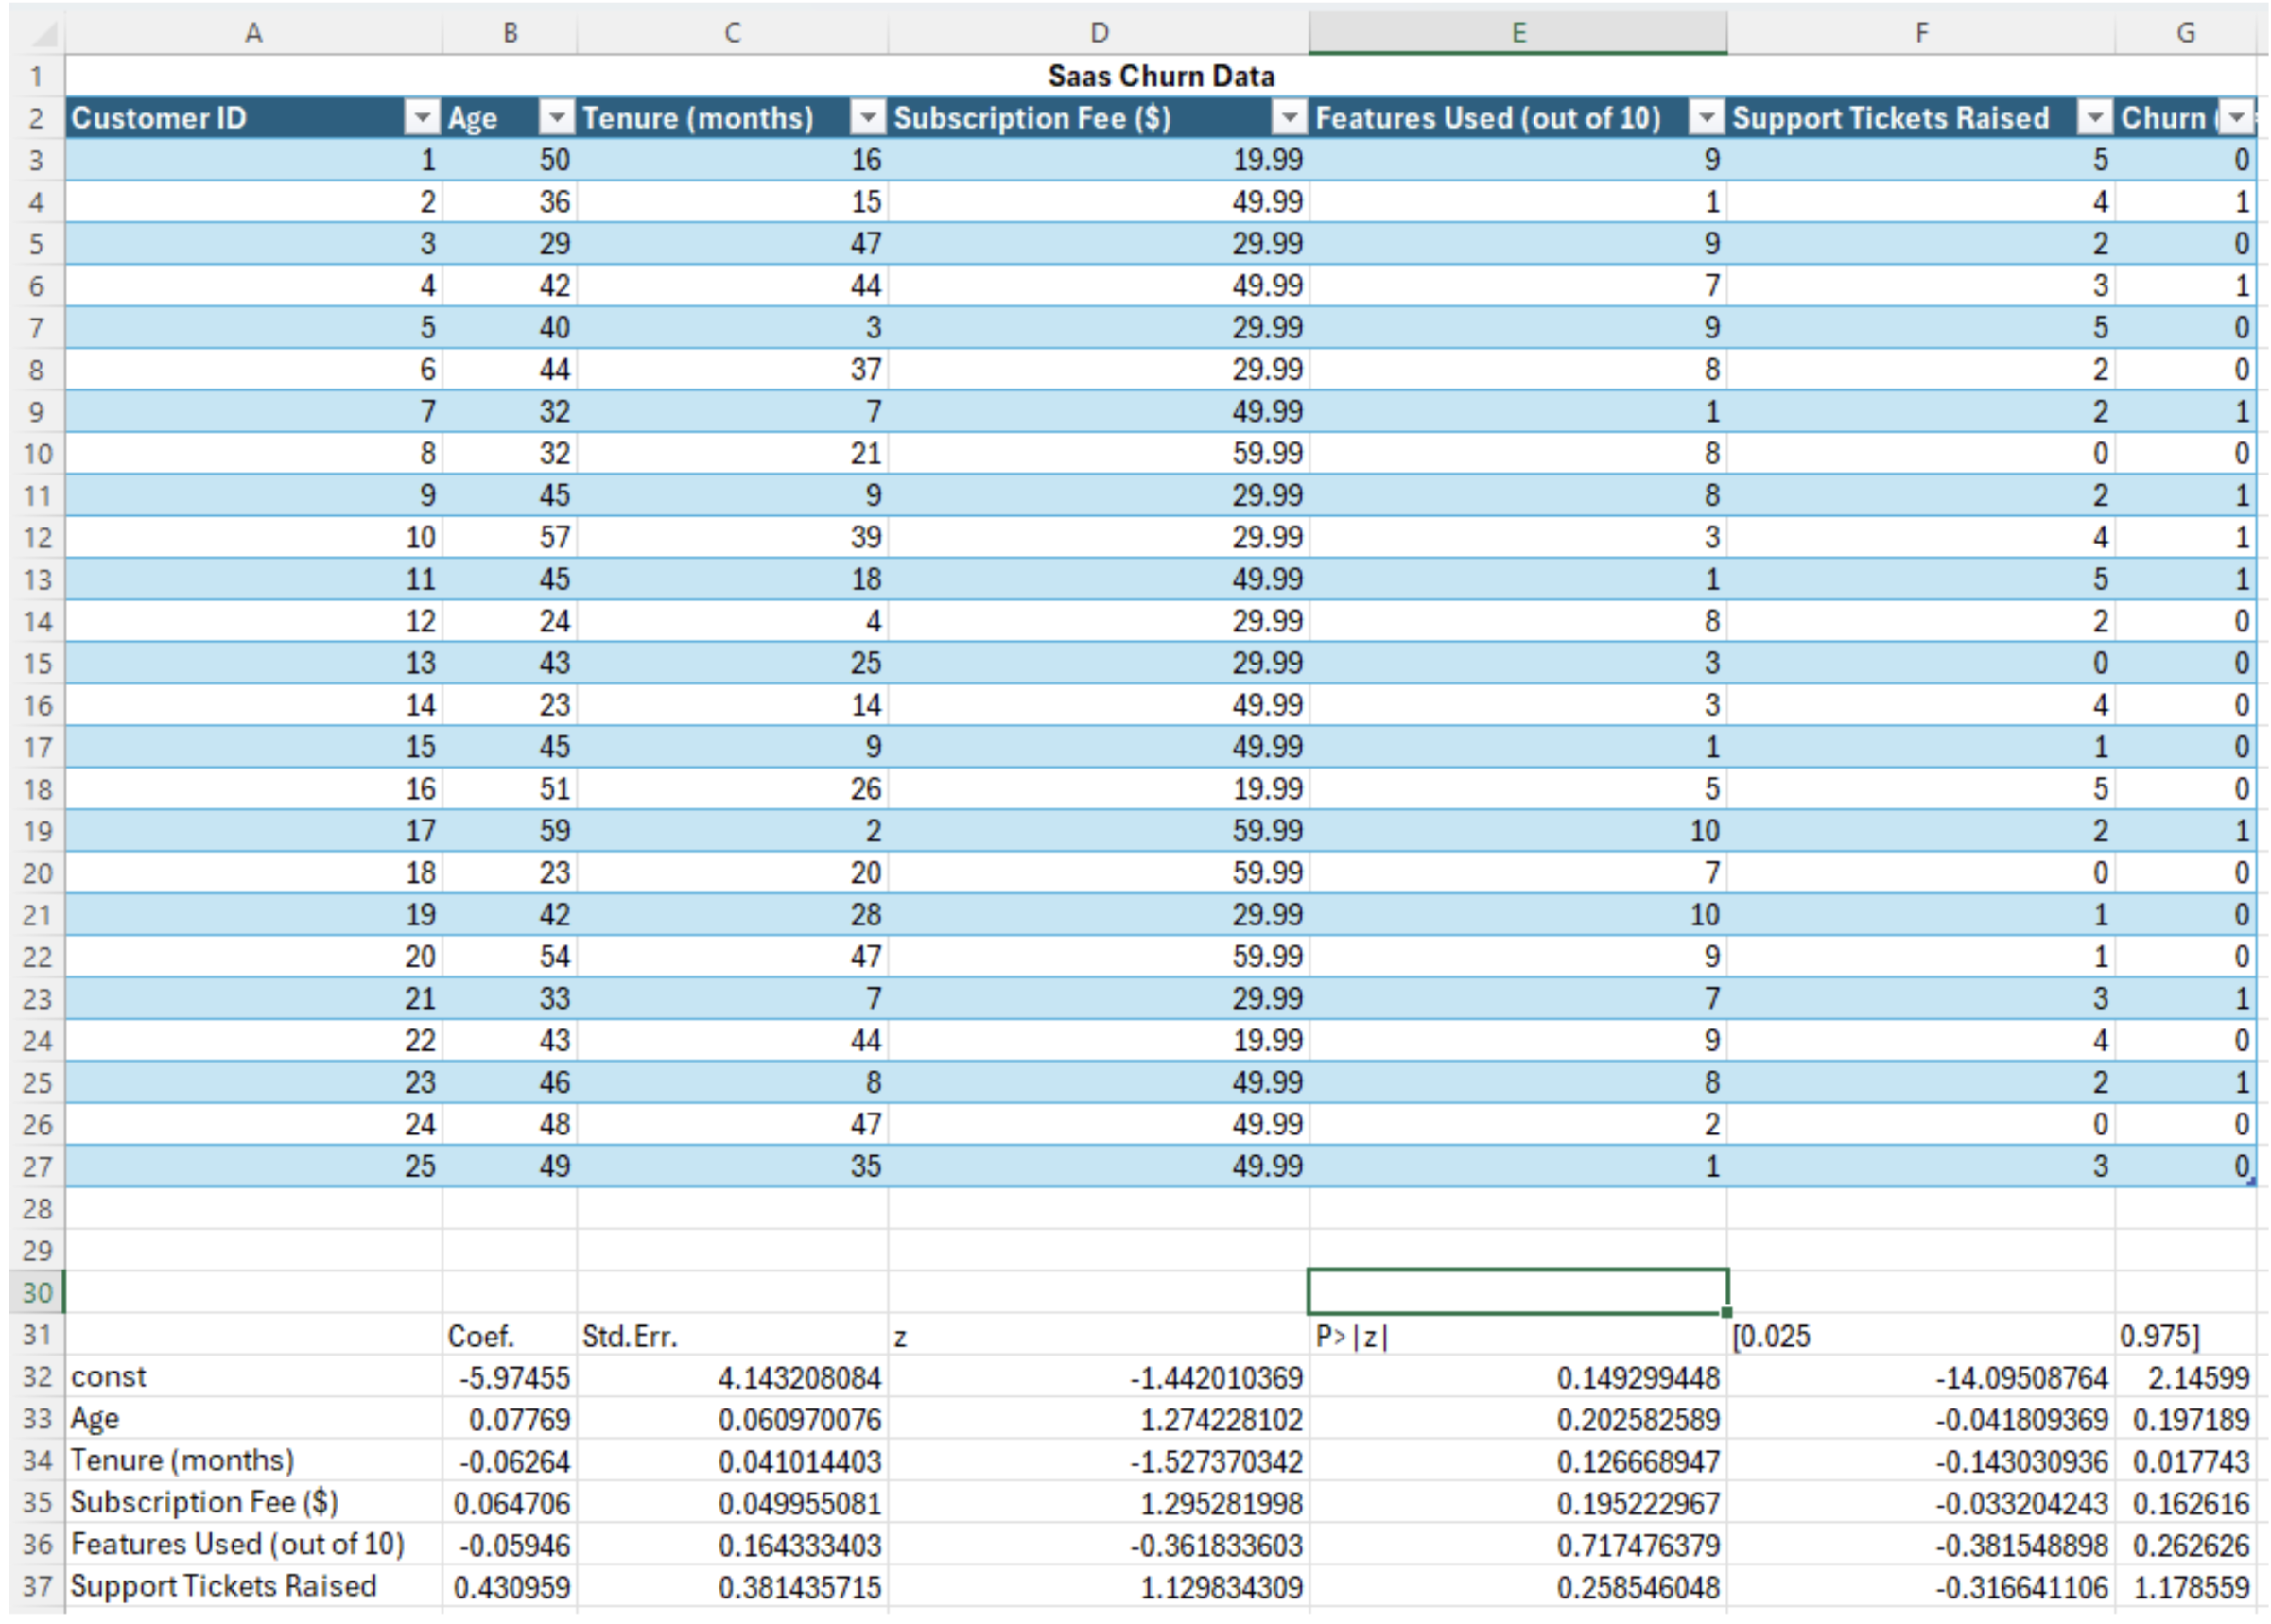
logit_model = sm.Logit(y, X).fit()
# Get the regression results
logit_model.summary2().tables[1]
We have the option to have our results show in the display panel on the right, or in Excel cells. With the results from our logistic regression model, we can make data-driven decisions on how to reduce churn. For example, if the model shows that customers with a higher subscription fee are more likely to churn, we might consider adjusting pricing tiers or offering additional benefits. If the number of support tickets raised is a significant factor, it could indicate that improving customer service could lead to higher retention rates.
By running these analyses directly in Excel, we can easily collaborate with teams that are already comfortable with Excel, while taking advantage of Python’s advanced capabilities.
Customer Segmentation Using Clustering
One of the most powerful tools in a marketer’s toolkit is customer segmentation. By dividing customers into distinct groups based on their behavior and preferences, businesses can create targeted marketing strategies, offer personalized promotions, and improve customer retention. Traditionally, customer segmentation has required external software or add-ins, as Excel alone is not equipped to handle complex clustering algorithms. However, with the integration of Python in Excel, marketers now have the ability to leverage advanced techniques like K-means clustering directly within their spreadsheets.
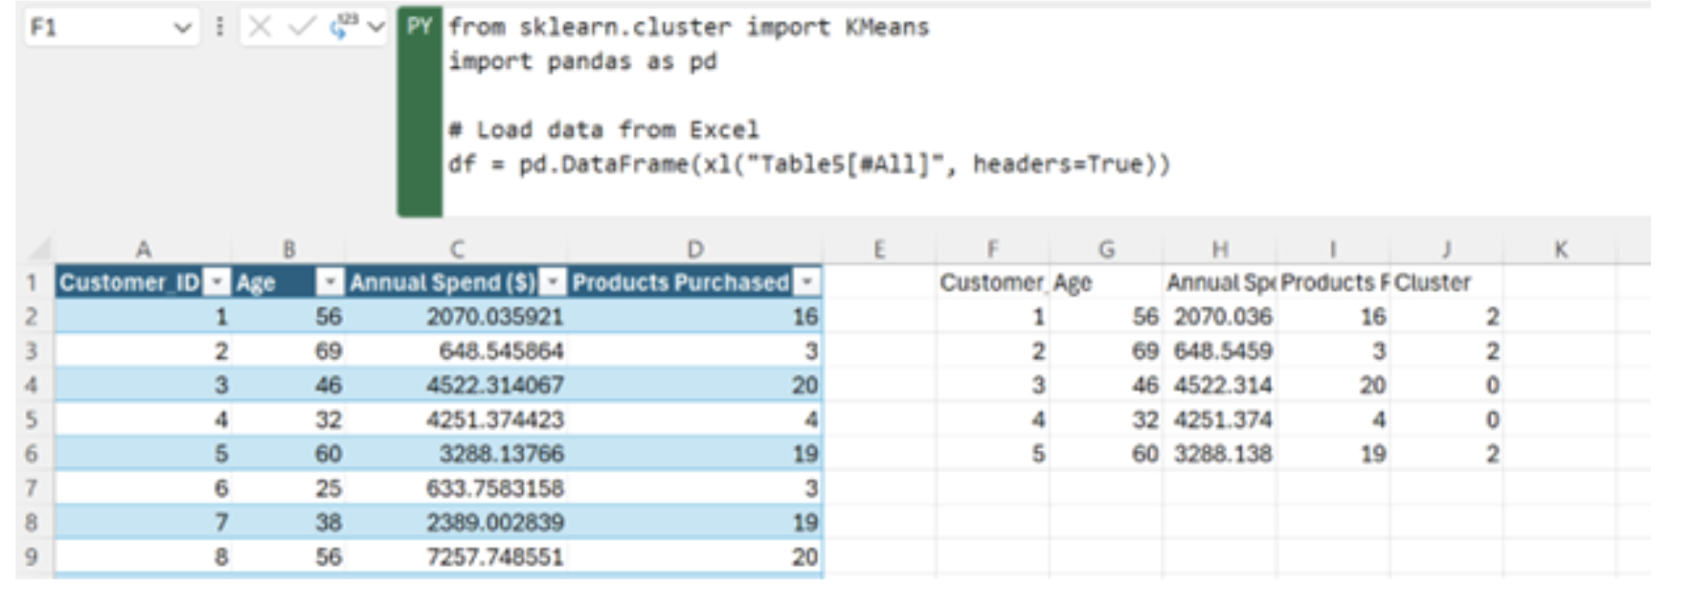
from sklearn.cluster import KMeans
import pandas as pd

# Load data from Excel
df = pd.DataFrame(xl("Table5[#All]", headers=True))

# Define features for clustering
X = df[['Age', 'Annual Spend ($)', 'Products Purchased']]

# Fit K-means clustering model
kmeans = KMeans(n_clusters=3)
df['Cluster'] = kmeans.fit_predict(X)

df.head()
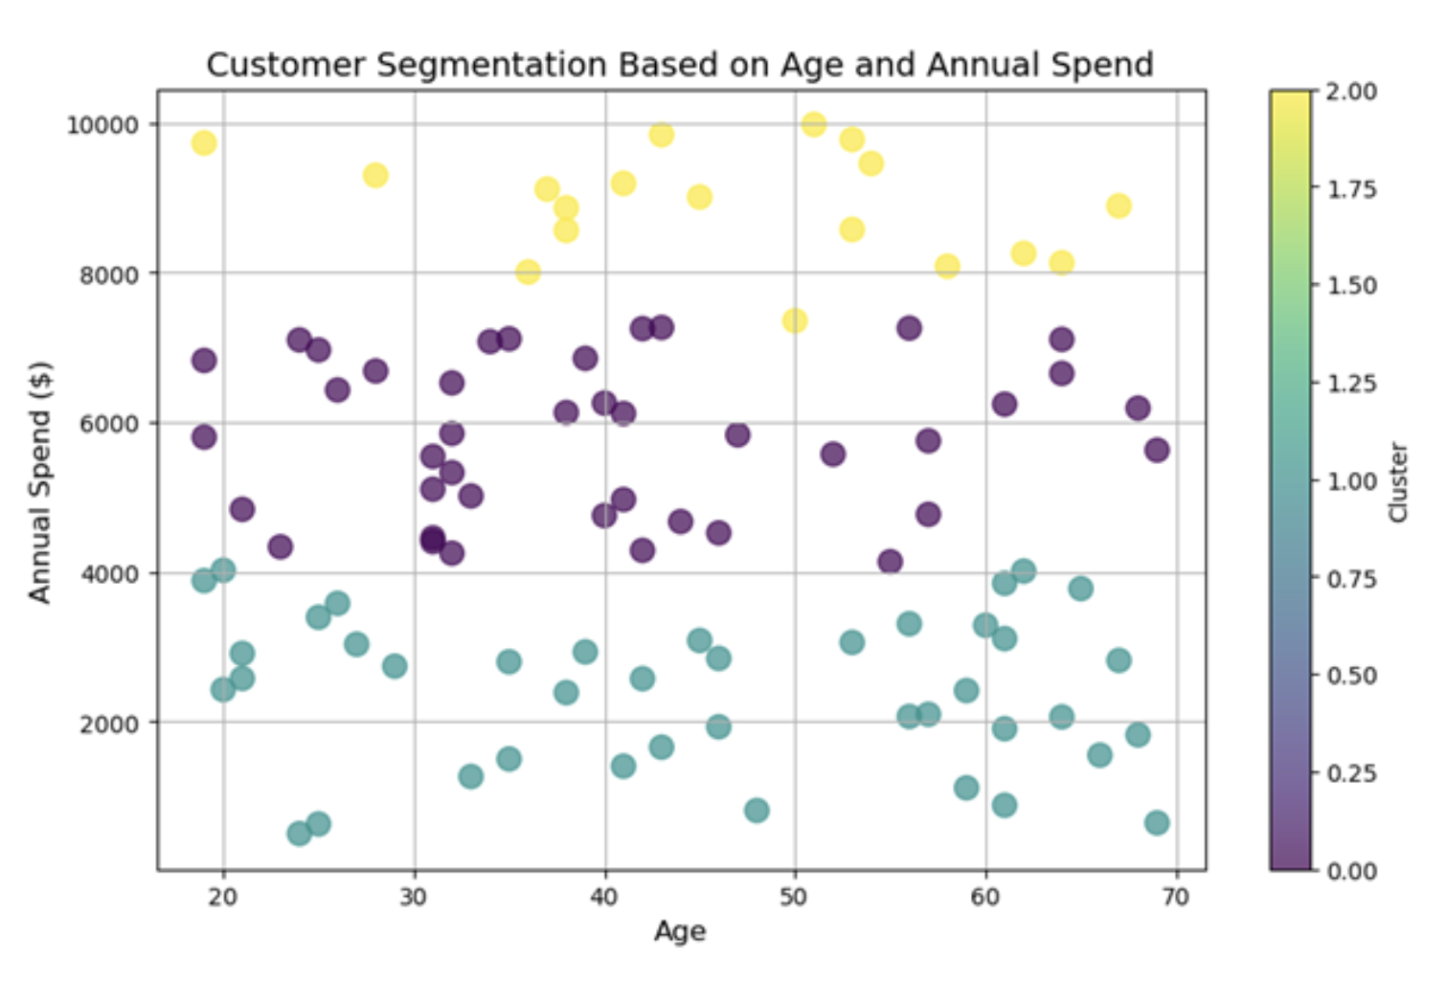
Clustering allows businesses to automatically group customers based on key characteristics such as age, annual spending, and purchasing habits. In this example, we apply K-means clustering to a dataset of fictitious customer data to uncover patterns that might not be immediately obvious. The algorithm organizes customers into three groups or clusters, each representing a unique segment. For instance, one group might consist of younger customers who spend less and purchase fewer products, while another group could represent older, high-spending customers who buy a wide variety of products. By identifying these segments, businesses can tailor their marketing efforts more effectively.
In the past, achieving this type of segmentation within Excel was difficult, if not impossible, without using third-party tools or exporting data to external software like Python or R. Marketers would need to rely on basic filters and pivot tables to analyze data, which could lead to oversimplified insights. Now, advanced algorithms like K-means clustering are at our fingertips. This integration allows for seamless workflows. Data remains within Excel while Python handles the heavy lifting and complex computations. We can even create complex visualizations showing the creation of clusters to share with our clients.
By identifying these key groups, companies can personalize their outreach and deliver marketing campaigns that resonate with specific audiences, ultimately boosting engagement and customer loyalty.
Conclusion
Whether you are analyzing customer behavior, running predictive models, or segmenting audiences, Python’s rich library of tools is now available within the Excel environment, helping you push beyond the traditional limits of marketing analytics without leaving the familiar interface.
In short, Python in Excel is not just an added feature, it is a way to elevate your marketing data analysis. It enables you to handle complex tasks with ease, stay ahead in a data-driven landscape, and make smarter, more impactful marketing decisions. As the marketing world evolves, this integration ensures that Excel remains a powerful, adaptable tool in your marketing toolkit, empowering you to unlock deeper insights and drive better results.
Want to work with these examples directly with Python and Excel, download the spreadsheet used in this blog post here.