Python in Excel
Oct 9, 2024
A Comprehensive List of Python in Excel Resources

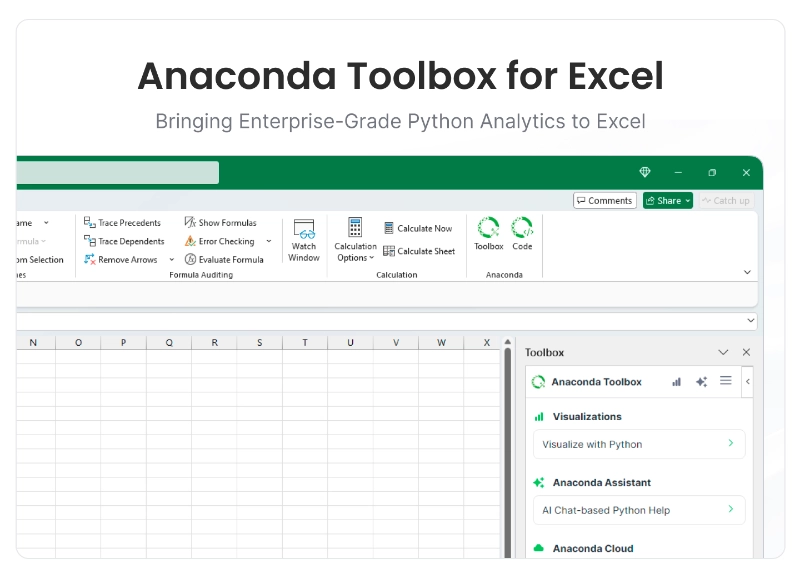
We are thrilled to announce the General Availability of Anaconda Toolbox for Excel!
Anaconda Toolbox for Excel is our comprehensive Excel add-in that brings critical data science tools directly to Excel users in the application they know and love. Starting today, organizations can take full advantage of Python in Excel and the Anaconda ecosystem with easy-to-use tools, featuring a completely redesigned visualization experience.
Anaconda Toolbox is an innovative Excel add-in that seamlessly integrates Python capabilities into Microsoft Excel, enabling users to leverage the power of Python analytics without leaving their familiar spreadsheet environment. At its core, Anaconda Toolbox for Excel transforms how organizations work with data by combining Excel’s accessibility with Python’s analytical prowess, all while maintaining enterprise-grade security and compliance.
Visualize with Python, the redesigned feature that is the centerpiece of this release, brings unprecedented ease and flexibility in reducing the time to insight with powerful data visualizations using Python in Excel. We conducted user research interviews and leveraged domain knowledge from Excel MVPs to reimagine the ‘Visualize with Python’ interface, making it easier than ever to create sophisticated visualizations using Python’s powerful libraries in a guided and intuitive way.
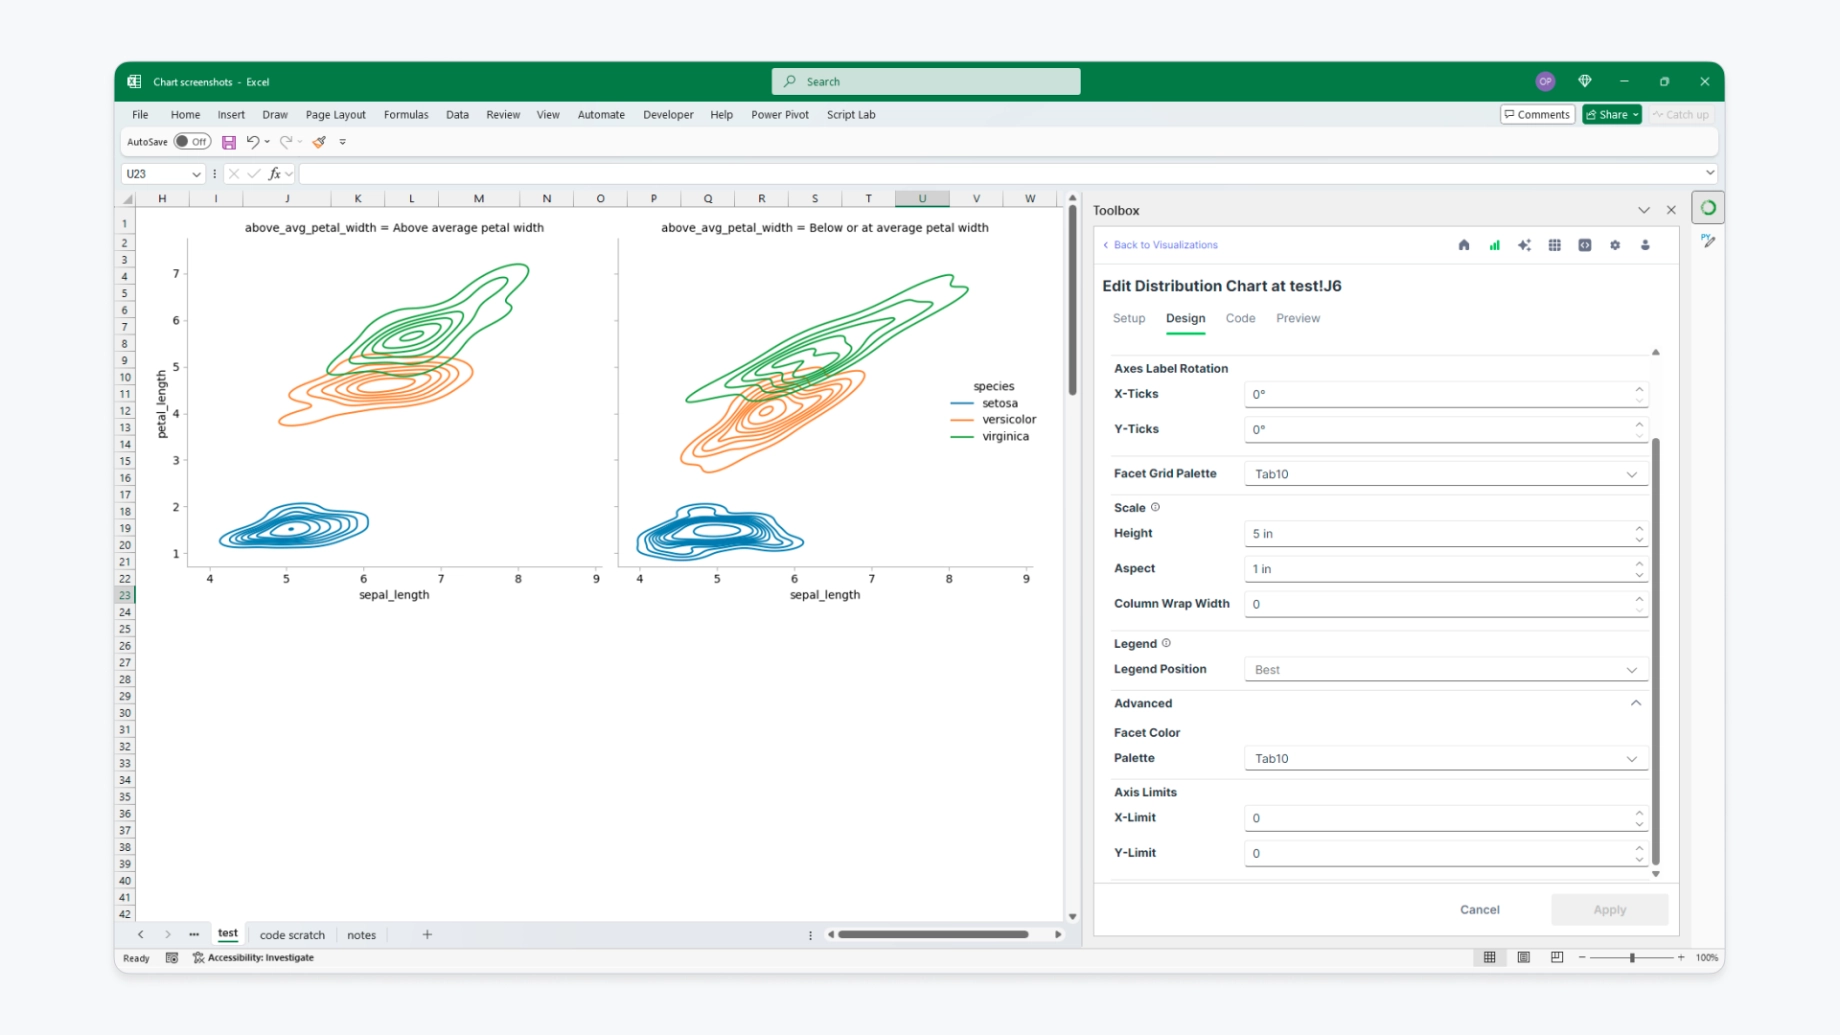
Figure 1: Faceted distribution charts offer multivariate analytics and insights
Key improvements to the Visualization Builder include:
See the new Visualization Builder feature in action:
While the Visualization Builder leads our GA release, Anaconda Toolbox offers a comprehensive suite of Python integration features:
– Execute Anaconda Code Python cells locally directly within the add-in
– Manage a secure PyScript environment with customizable package management
– Create user-defined functions with Python and call them by name from the grid!
Read more on the Anaconda Blog
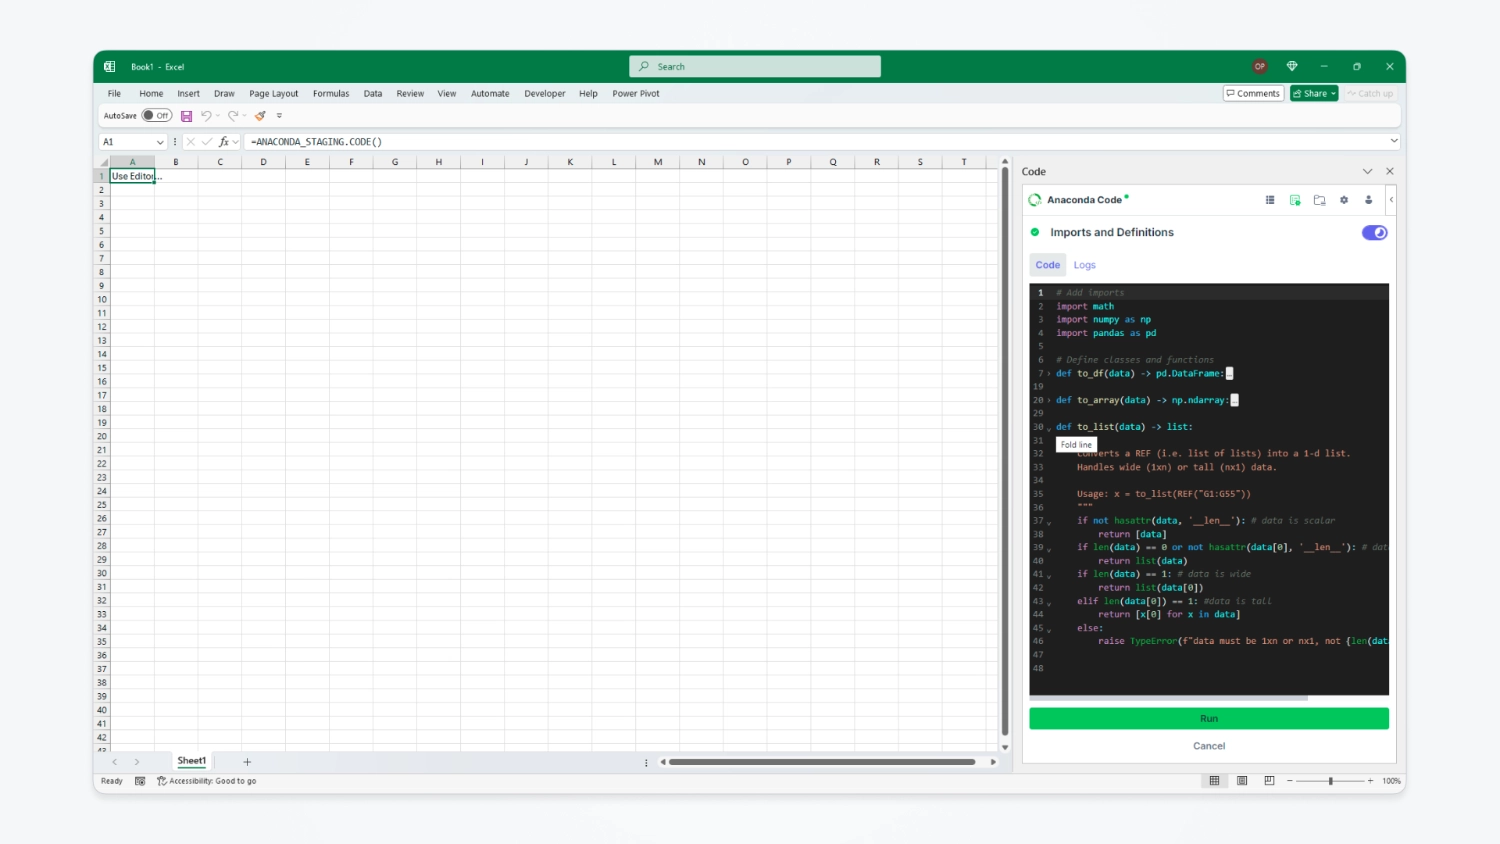
Figure 2: Anaconda Code includes a dedicated Imports and Definitions script where users can set project imports and initialize important functions and classes
– Securely upload and manage datasets in Anaconda Cloud
– Share data assets across your organization including with your data scientist colleagues using Anaconda Toolbox for Notebooks
– Create and manage reusable Python code blocks
– Have all your predefined logic and custom classes available in any Excel file you open
– Share code snippets across your organization using Anaconda Toolbox for Notebooks
– Quickly implement common data analysis patterns
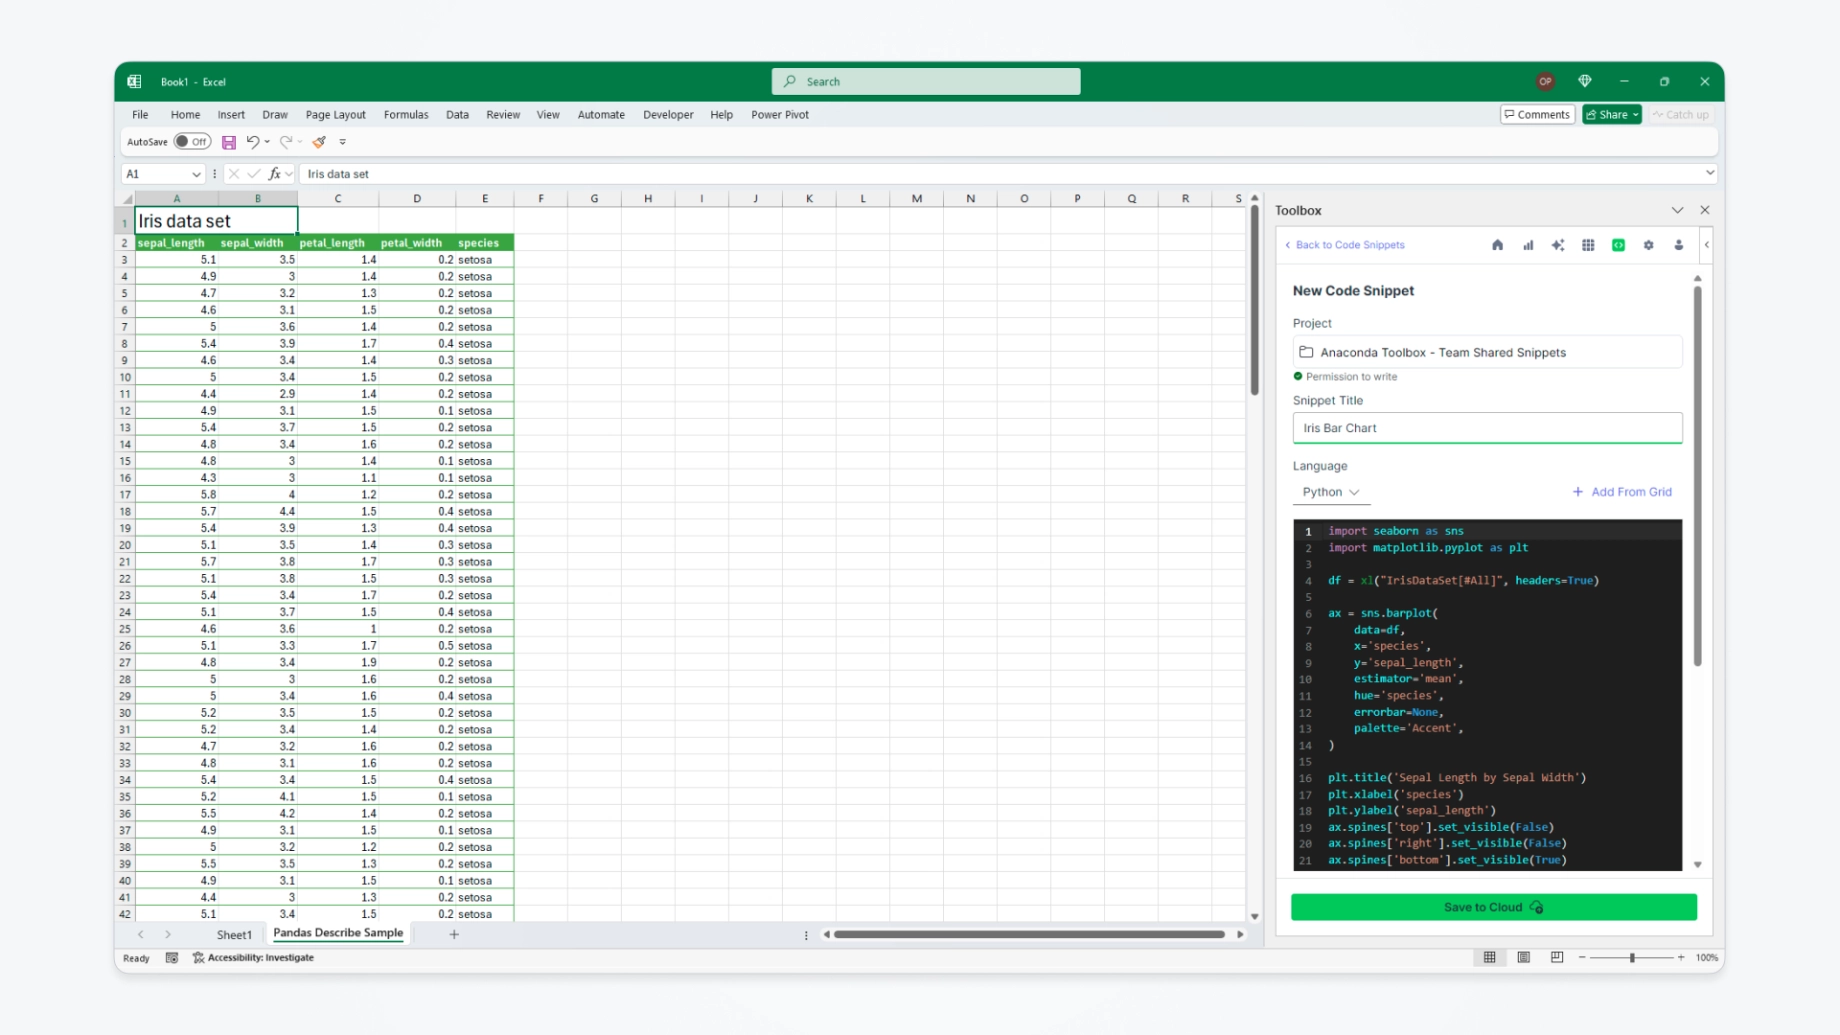
Figure 3: Users can save Python code as snippets in their Anaconda Cloud account, meaning they can re-use in any other workbook or notebook
– Get AI-powered help with Python coding tasks
– Create insightful analyses with a familiar chat interface
– Debug code and receive contextual suggestions
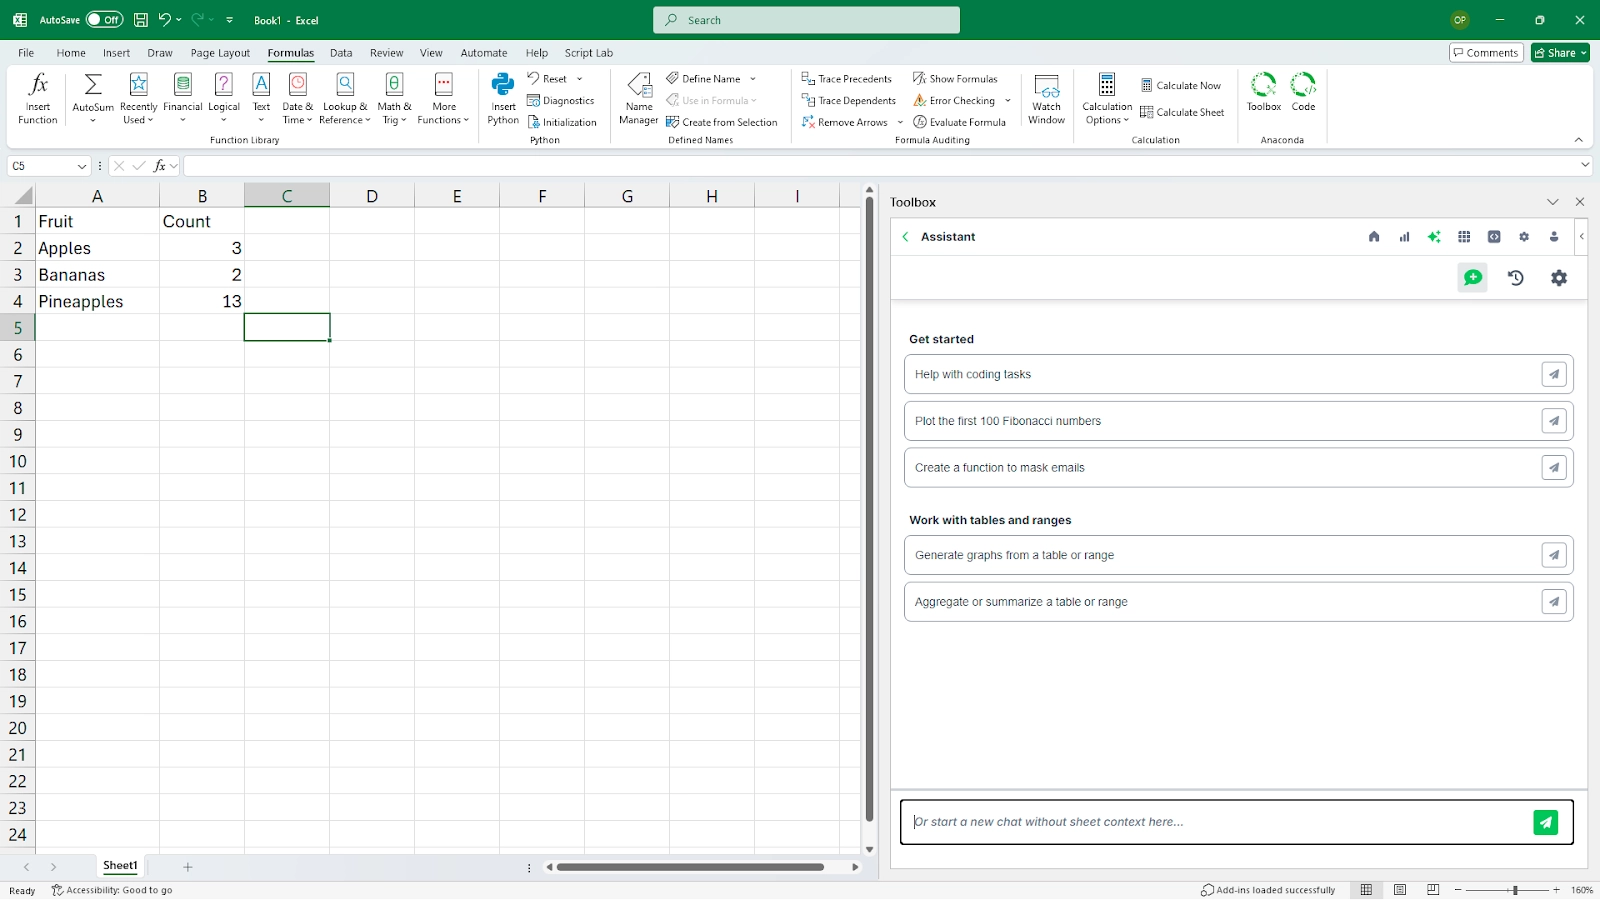
Figure 4: Anaconda Assistant offers a number of options to get started
In this example, Assistant was asked to run K-nearest neighbor clustering on a dataset and to then provide a scatterplot of the clusters.
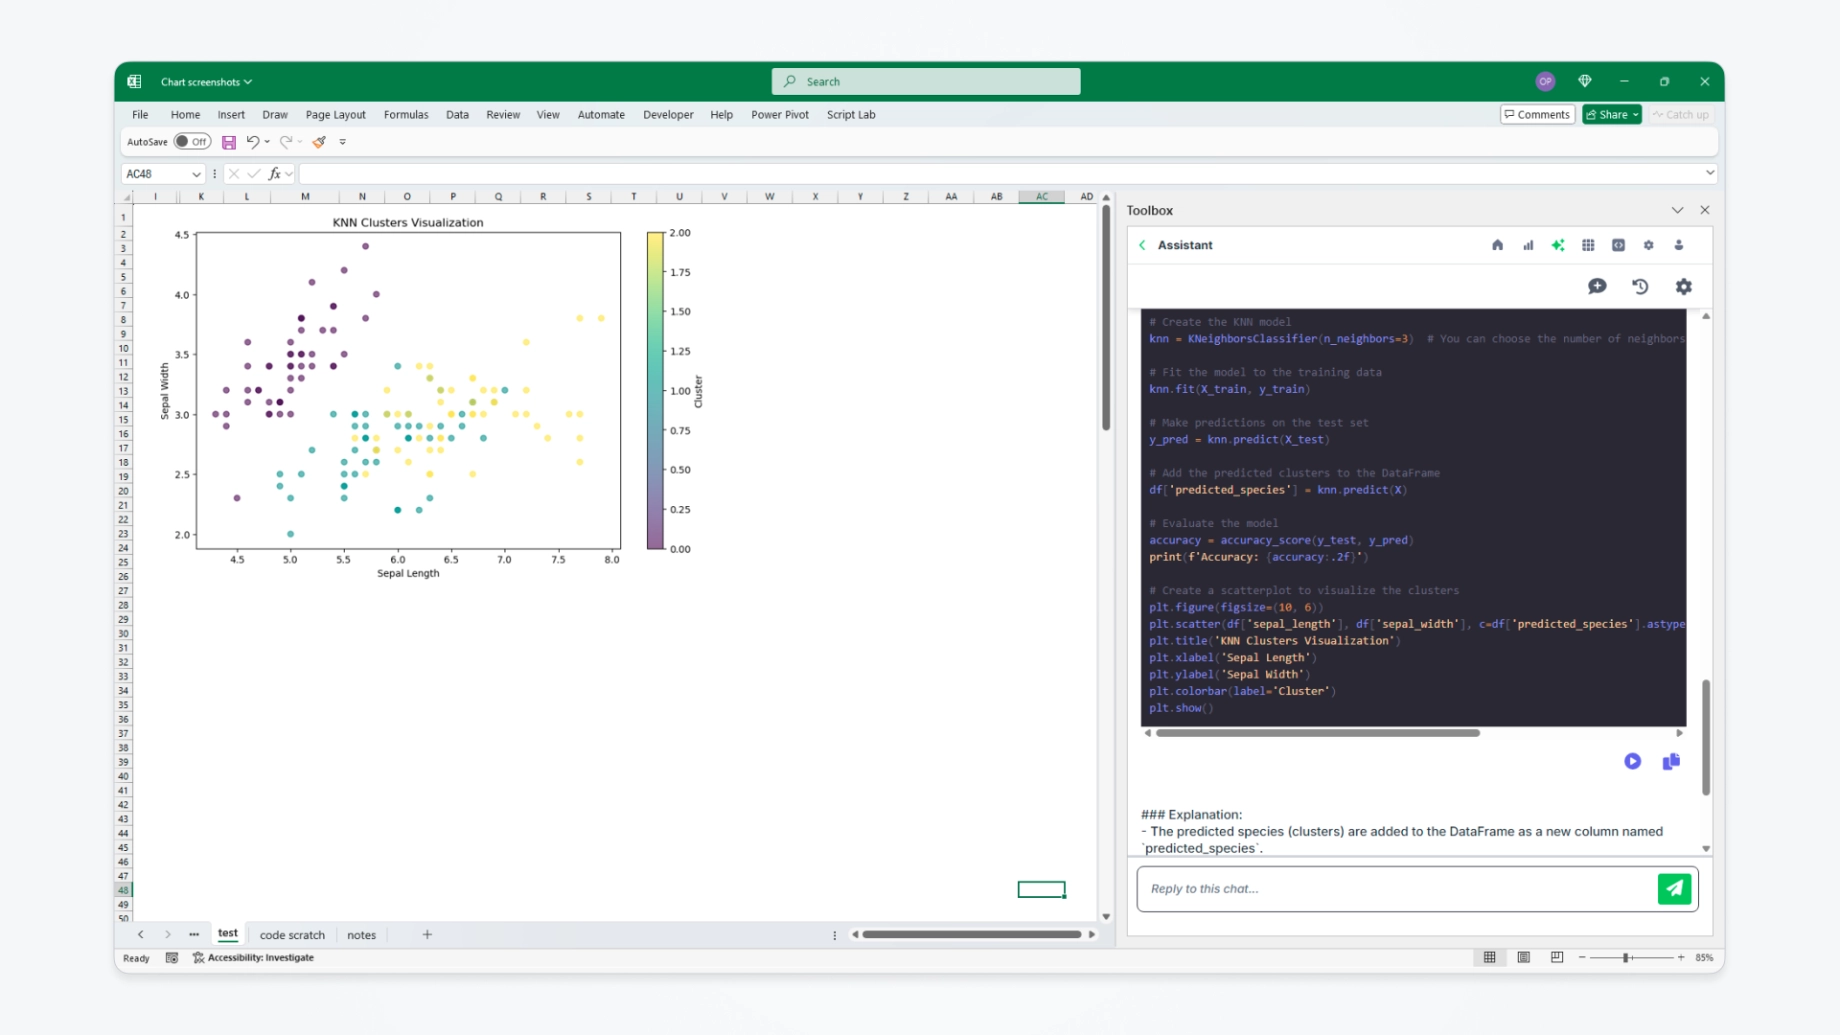
Figure 5: Users can get help with data science and Python programming tasks such as clustering with the K-nearest neighbors algorithm
Anaconda Toolbox is built with enterprise requirements in mind:
Anaconda Toolbox revolutionizes how organizations work with data in Excel by:
– Eliminating the need to switch between Excel and Python environments
– Reducing the learning curve for Python adoption in Excel-centric organizations
– Enabling sophisticated AI-driven data analysis within familiar Excel workflows
– Directly connecting Excel users with their Notebooks colleagues
Organizations can deploy Anaconda Toolbox through Microsoft’s AppSource, making it easily accessible to Excel users. The add-in seamlessly integrates with existing Excel workflows and requires no local Python installation.
To get started, visit Microsoft AppSource and search for Anaconda Toolbox. Users will need to have a free Anaconda Cloud account to get started. View our full on Anaconda Toolbox for Excel on our docs site.
If you wish to enhance your data visualization skills, register for our upcoming live course on January 23, 2025, Data Visualization with Python in Excel. During this interactive live course by Owen Price, you’ll learn how to use both Python in Excel and Anaconda Toolbox for Excel to craft compelling data visualizations. If you’re a paid subscriber, you can attend this live course for FREE. To register, click here.
If you’re new to Python in Excel, check out our on-demand webinar Introduction to Python in Excel. During this webinar, we cover Python in Excel basics, understanding data types and output modes, a brief introduction to Pandas DataFrames, custom functions, and a simplified Python charting experience using the Anaconda Toolbox for Excel. You can watch the webinar here.
Talk to one of our experts to find solutions for your AI journey.